
- Title
-
Ccn2a-FGFR1-SHH signaling is necessary for intervertebral disc homeostasis and regeneration in adult zebrafish
- Authors
- Rayrikar, A.Y., Wagh, G.A., Santra, M., Patra, C.
- Source
- Full text @ Development
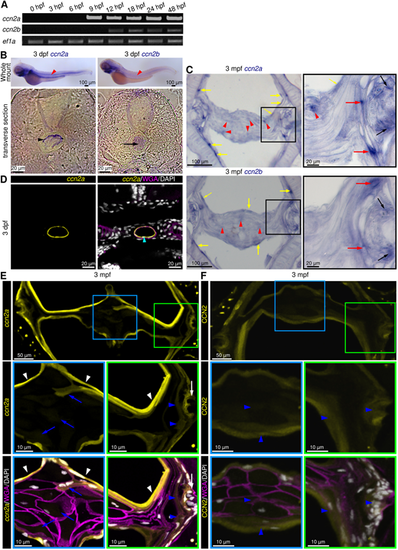
ccn2a and ccn2b are expressed in larval notochord and adult IVDs. (A) Semi-qPCR analysis of ccn2a and ccn2b in zebrafish embryos. ef1a is loading control. (B) Bright-field images of whole-mount in situ hybridized embryos and their transverse sections. Red arrowheads indicate ccn2a or ccn2b expression in the notochord. Black arrowhead and arrow show ccn2a transcripts in the NSCs and ccn2b transcripts in the NCs, respectively. (C) ccn2a and ccn2b expression on sagittal sections of an IVD. Black, red and yellow arrows indicate ccn2a- or ccn2b-expressing cells in the OAF, IAF and NSCs, respectively. Red arrowheads show weak ccn2a and ccn2b expression in the NP cells. (D) BACccn2a:EGFP expression (yellow) in a transverse section of a 3 dpf embryo stained using WGA (magenta; cell membrane) and DAPI (white; nuclei). Arrowhead indicates EGFP expression in the NSCs. (E) BACccn2a:EGFP expression (yellow) in a sagittal section of IVD stained using wheat germ agglutinin (magenta; cell membrane) and DAPI (white; nuclei). White arrows and arrowheads indicate EGFP expression in OAF and sheath cells, respectively. Blue arrows and arrowheads indicate weak EGFP expression in NP and IAF cells, respectively. (F) Maximum intensity projections of confocal images of a sagittal section of IVD immunostained for Ccn2 (yellow), and counterstained using WGA (magenta; cell membrane) and DAPI (white; nuclei). Arrowheads indicate ubiquitous localization of Ccn2 throughout the IVD. |
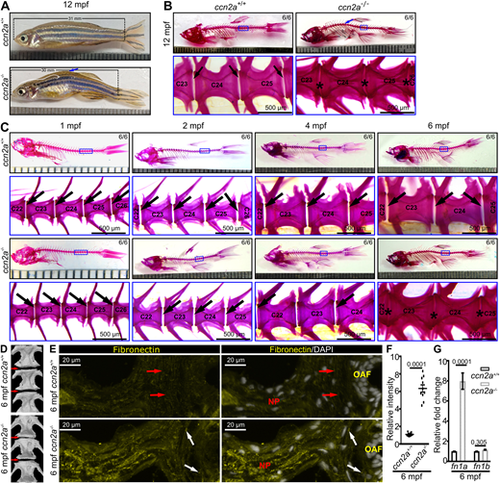
ccn2a−/− exhibits IVDD in adult zebrafish. (A) Bright-field images. Arrow indicates the curvature in the body axis of ccn2a−/−. (B,C) Bright-field images of whole-mount AB/AR stained animals. Blue arrows in B indicate the curvature in the spine of ccn2a−/−. Black arrows indicate intervertebral gaps, which are not visible in ccn2a−/− at 6 mpf. (D) µCT images of zebrafish spine. Arrows indicate the intervertebral region. (E) Maximum intensity projections of confocal images of IVD sagittal sections immunostained for fibronectin (yellow) and stained with DAPI (white; nuclei). Red and white arrows indicate striated and fragmented fibronectin expression in the IAF of the wild-type and ccn2a−/− IVD, respectively. Increased fibronectin expression is visible in the ccn2a−/− IVD. (F) Quantification of E (n=10). The mean of the wild-type control value was set to 1. (G) Quantification of fn1a and fn1b expression in vertebral tissues (n=4). Mean Ct values can be found in Table S5. In F and G, data are mean±s.e.m.; each sample represents one animal. Digits on the images in B and C indicate the number of fish that showed the presented phenotype out of the total number of fish. ‘C’ on images in B and C represents centrum/vertebrae. |

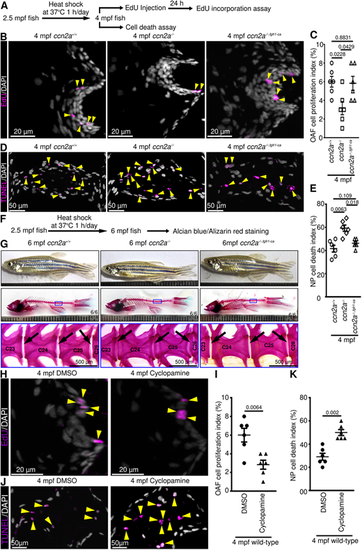
Adult ccn2a−/− display decreased OAF cell proliferation, increased NP cell death and decreased SHH signaling. (A,B) Maximum intensity projections (MIPs) of confocal images of sagittal IVD sections stained for EdU (magenta; proliferating cells) and nuclei (white; DAPI) (A) or stained for TUNEL (magenta; dead cells) and nuclei (white; DAPI) (B). Yellow and green arrowheads indicate EdU+ OAF cells and TUNEL+ NP cells, respectively. (C) MIPs of confocal images of sagittal IVD sections stained for EdU (magenta; proliferating cells) and stained with DAPI (white; nuclei). Arrowheads indicate EdU+ cells. (D) Quantification of OAF cell proliferation (n=6). (E) MIPs of confocal images of IVD sagittal sections stained for TUNEL (magenta; dead cells) and stained with DAPI (white; nuclei). Arrowheads indicate TUNEL+ NP cells. (F) Quantification of NP cell death (n=6). (G) qPCR to identify differentially expressed genes in 4 mpf ccn2a−/− vertebral tissues (n=4). (H) shha and shhb expression on sagittal sections of IVD. Arrows indicate mRNA expression. (I) Quantification of gli1, ptch1 and ptch2 expression in vertebral tissues (n=4). In D,F,G,I, data are mean±s.e.m.; each sample represents one animal. Mean Ct values can be found in Table S5. |

FGFR1 signaling regulates shha and shhb expression, OAF cell proliferation, and NP cell survival in adult IVDs. (A) Quantification of FGFR expression in vertebral tissues (n=4). (B) fgfr1a and fgfr1b expression on sagittal sections of IVD. (C) Schematic of experimental procedures. (D,E) qPCR analysis of shha and shhb (D), and fgfr1b and ccn2a (E) expression in vertebral tissues (n=4). (F) Schematic of experimental procedures. (G) qPCR analysis of shha, shhb and fgfr1b expression in vertebral tissues (n=4). (H) Schematic of experimental procedures. (I) Maximum intensity projections (MIPs) of confocal images of sagittal IVD sections stained for EdU (magenta; proliferating cells) and stained with DAPI (white; nuclei). Arrowheads indicate EdU+ OAF cells. (J) Quantification of proliferating OAF cell (n=6). (K) MIPs of confocal images of sagittal IVD sections stained for TUNEL (magenta; dead cells) and stained with DAPI (white; nuclei). Arrowheads indicate TUNEL+ NP cells. (L) Dot plot showing the percentage of TUNEL+ NP cells (n=6). In A,D,E,G,J,L, data are mean±s.e.m.; each sample represents one animal. Mean Ct values can be found in Table S5. |
Ectopic expression of a constitutively active form of Fgfr1 can restore cellular phenotype in adult ccn2a−/− IVDs through SHH signaling. (A) Schematic depiction of experimental procedures. (B) Maximum intensity projections (MIPs) of confocal images of sagittal IVD sections stained for EdU (magenta; proliferating cells) and nuclei (white). Arrowheads indicate EdU+ cells in the OAF. (C) Quantification of proliferating OAF cell (n=6). (D) MIPs of confocal images of sagittal IVD sections stained for TUNEL (magenta; dead cells) and nuclei (white). Arrowheads indicate TUNEL+ cells in the NP. (E) Quantification of NP cell death (n=6). (F) Schematic depiction of experimental procedures. (G) Bright-field lateral views of live and AB/AR stained zebrafish. Black arrows indicate intervertebral spaces. Scale is marked in millimeter intervals. (H) MIPs of confocal images of sagittal IVD sections stained for EdU (magenta; proliferating cells) and stained with DAPI (white; nuclei). Arrowheads indicate EdU+ cells in the OAF. (I) Quantification of proliferating OAF cells (n=6). (J) MIPs of confocal images of sagittal IVD sections stained for TUNEL (magenta; dead cells) and nuclei (white). Arrowheads indicate TUNEL+ cells in the NP. (K) Quantification of NP cell death (n=6). In C,E,I,K, data are mean±s.e.m.; each sample represents one animal. Digits on the images in G indicate the number of fish that showed the presented phenotype out of the total number of fish. ‘C’ on images in G represents centrum/vertebrae. |
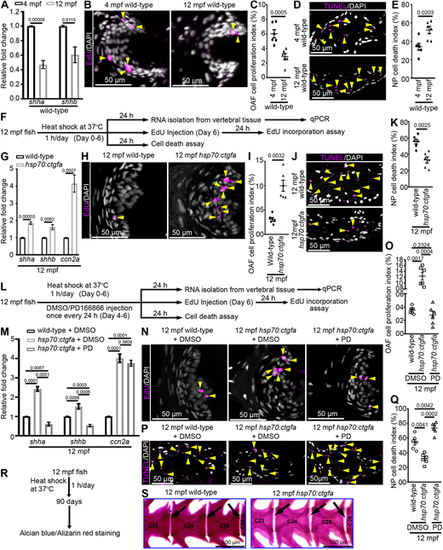
Ccn2a induces regeneration in aged IVDs by inducing FGFR1 signaling. (A) qPCR analysis of shha and shhb expression in vertebral tissues (n=4). (B) Maximum intensity projections (MIPs) of confocal images of sagittal IVD sections stained for EdU (magenta; proliferating cells) and nuclei (white). Arrowheads indicate EdU+ cells in the OAF. (C) Quantification of proliferating OAF cells (n=6 each). (D) MIPs of confocal images of sagittal IVD sections stained for TUNEL (magenta; dead cells) and nuclei (white). Arrowheads indicate TUNEL+ cells in the NP. (E) Quantification of NP cell death (n=6). (F) Schematic of experimental procedures. (G) qPCR analysis of shha, shhb and ccn2a expression in vertebral tissues (n=4). (H) MIPs of confocal images of sagittal IVD sections stained for EdU (magenta; proliferating cells) and nuclei (white). Arrowheads indicate EdU+ cells in the OAF. (I) Quantification of proliferating OAF cells (n=6). (J) MIPs of confocal images of sagittal IVD sections stained for TUNEL (magenta; dead cells) and nuclei (white). Arrowheads indicate TUNEL+ cells in the NP. (K) Quantification of NP cell death (n=6). (L) Schematic of experimental procedures. (M) qPCR analysis of shha, shhb and ccn2a expression in vertebral tissues (n=4). (N) MIPs of confocal images of sagittal IVD sections stained for EdU (magenta; proliferating cells) and nuclei (white). Arrowheads indicate EdU+ cells in the OAF. (O) Quantification of proliferating OAF cells (n=6). (P) MIPs of confocal images of sagittal IVD sections stained for TUNEL (magenta; dead cells) and nuclei (white). Arrowheads indicate TUNEL+ cells in the NP. (Q) Quantification of NP cell death (n=6). (R) Schematic of experimental procedures. (S) Bright-field lateral views of AB/AR-stained zebrafish. Black arrows indicate intervertebral spaces. In A,C,E,G,I,K,M,O,Q, data are mean±s.e.m.; each sample represents one animal. PD, PD166866. Mean Ct values can be found in Table S5. |
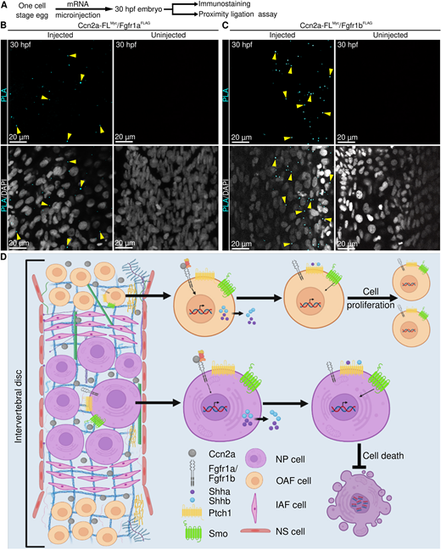
Ccn2a interacts with Fgfr1a and Fgfr1b in vivo. (A) Schematic of experimental procedures. (B,C) Representative single plane optical sections of whole-mount 30 hpf embryos stained for proximity detection (cyan, interacting complex) and nuclei (white). Arrowheads in B indicate an interaction between C-terminal Myc-tagged Ccn2a and N-terminal FLAG-tagged Fgfr1a (cyan). Arrows in C indicate an interaction between N-terminal Myc-tagged Ccn2a and N-terminal FLAG-tagged Fgfr1b (cyan). (D) Model of the signaling cascade regulated by Ccn2a, which promotes cell proliferation and inhibits cell death. |