
- Title
-
TEMPO enables sequential genetic labeling and manipulation of vertebrate cell lineages
- Authors
- Espinosa-Medina, I., Feliciano, D., Belmonte-Mateos, C., Linda Miyares, R., Garcia-Marques, J., Foster, B., Lindo, S., Pujades, C., Koyama, M., Lee, T.
- Source
- Full text @ Neuron

TEMPO design and implementation (A) Two TEMPO transgenes enable sequential activation of three reporters (CFP-RFP-YFP, T, temporal windows) by a conditional gRNA cascade. gRNAs and their corresponding targets are color coded. (B) TEMPO allows genetic access and simultaneous visualization of sequentially produced cells in their anatomical context. Dashed lines represent an undefined number of cell divisions. (C) Representation of the repair mechanism, single-strand annealing (SSA), required to activate frame and gRNA switches (D and E). (D) Frame switch design: Activation of a reporter (OFF—ON, F1, frame 1) after a double strand break (DSB) by CRISPR-Cas9 followed by SSA causes a frame shift, inactivating the downstream reporter (OFF, F2, frame 2). (E) A conditional gRNA activated by another gRNA through SSA repair. (F) Frame switch transitions assessed by expression of fluorescent reporters in 3 days post-fertilization (dpf) zebrafish larvae. Plots indicate mean ± SEM of reporter fluorescence activated in the presence (+) or absence (–) of the gRNA, representing efficiency or leakiness of the transition, respectively (n = 21 fish, at least 4 independent experiments/condition). (G) A gRNA switch fluorescent assay enables characterization of the conditional gRNA-2 switch efficiency (+) and leakiness (–) in the presence or absence of gRNA-1, respectively (n = 13–17 fish/condition, 4 independent experiments). E, eye. |

TEMPO enables sequential cell labeling in live zebrafish embryos (A) Co-injection of Tol1 integrative ubiquitous TEMPO and Cas9 constructs into 1-cell-stage zebrafish embryos. TEMPO transitions analyzed in live embryos between 8 and 96 h post fertilization (hpf). (B) Snapshots of ubiquitously expressed TEMPO reporter cascade in live zebrafish embryos. Scale bars, 50 μm. (C) Insets highlight a cell clone imaged at 48 and 72 h including (a) non-dividing cells which do not transition in the cascade and (b) dividing cells which transition to the last color (YFP). (D) Changes in TEMPO color distribution (percentage of fluorescent cells for each color reporter along time) demonstrate efficient reporter transitions in a predefined order in developing zebrafish (8 h, n = 8; 24 h, n = 5; 48 h, n = 6; 72 h, n = 4; 96 h, n = 4, error bars represent SEM). (E) Normalization of data shown in (D) to the maximum fluorescence for each reporter along time. (F) Efficiency of color transition, defined as the ratio between the final proportion of TEMPO+ cells at 96 h (output) over the proportion of initial TEMPO+ cells at 8 h (input) for any given reporter transition. Data are shown as percentage ± SEM. |

TEMPO reveals spatiotemporal cell histories in the zebrafish hindbrain (A) Schematic representation of atoh1a progenitor domain in orthogonal hindbrain sections during early (ti) or late (tf) developmental stages. Inset in (A): known differences in proliferation and migration between dorsal and ventral atoh1a progenitors (1, 2, first or second cell division, respectively). (B) Co-injection of Tol1 constructs (UAS:TEMPO-gRNA-1 and her4.1:Cas9-gRNA-2 switch) into Tg[atoh1a-Gal4] positive zebrafish embryos. (C) Representative images of TEMPO transitions in the atoh1a domain. Upper panels: dorsal view of zebrafish hindbrain. Lower panels: orthogonal z-projections of the insets in upper panels. Arrow: Representative YFP+ clone derived from a late-born progenitor. Arrowhead: CFP+ clone derived from early-born progenitors. (D) Percentage of atoh1a+ fluorescent cells and color distribution along time. (E) Medio-lateral distribution of atoh1a derivatives within a given clone. Data in (D) and (E) are shown as percentage ± SEM (n = 5 fish, 3 independent experiments). (F) Correlation between birthdate and spatial distribution of vsx2 neurons in dorsal (upper panel) and orthogonal (lower panels) views of the zebrafish hindbrain. (G) TEMPO activation in vsx2 neurons using the transgenic lines Tg[vsx2:Gal4;UAS:TEMPO] and Tg[her4.1:Cas9]. (H) Lateral (left) and dorsal (center) views of a representative fish expressing all transgenes at 6 dpf. (Right) Orthogonal projections of the regions indicated in the left panels (i–iii). (I) Distribution of TEMPO+ neuronal projections in a representative fish (color-coded arrows point to projections arranged medio-laterally by increasing birthdate). Asterisk: YFP+ neuronal body located medial to the neuronal projections of YFP+ neurons. (J and K) Dorso-ventral distribution of TEMPO+ vsx2 neurons in rhombomeres R2-5 (J) or R6 (K). Data shown as percent ± SEM. n = 5. Scale bars, 50 μm. hpf, hours post fertilization. |
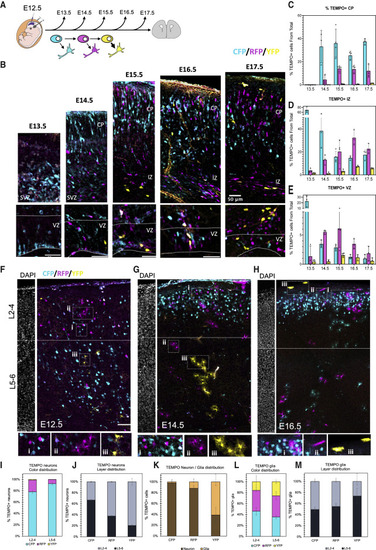
TEMPO connects sequential cell birth date and layer position in the mouse brain (A) In utero electroporation (IUE) of ubiquitous TEMPO constructs into E12.5 mouse brains and analysis at subsequent developmental stages. (B) Representative confocal images of mouse cortex at different stages following electroporation of TEMPO at E12.5. VZ, ventricular zone. SVZ, subventricular zone. IZ, intermediate zone. CP, cortical plate. Scale bars, 50 μm. (C–E) Distribution of TEMPO reporters in VZ, IZ, and CP along time. Plots represent the mean percentage of fluorescent cells from the total of cells in that brain section ± SEM, 3 independent experiments. (F–H) Postnatal P10 brain sections from mice electroporated with TEMPO constructs at stages E12.5–E16.5. DAPI labeling (separated adjacent panels) shows the limit between upper (L2-4) and lower (L5-6) cortical layers (dashed line). Insets highlight representative examples of TEMPO+ neurons (i) and astrocytes (ii and iii). (I) Percentage of neurons expressing each TEMPO reporter in L2-4 or L5-6. (J) Layer distribution of TEMPO+ neurons reveals an “inside-out” pattern. (K) Neuron and glia ratio for each reporter. (L) Percentage of astrocytes expressing each TEMPO reporter in L2-4 or L5-6. (M) Layer distribution of TEMPO+ astrocytes for each reporter. Data are represented as percent ± SEM. n = 3, Scale bars (F–H) 100 μm. |

Temporal genetic manipulation of cell cycle regulators in mouse brain progenitors (A and B) Design of TEMPOE constructs overexpressing a transgene in the first temporal window with the CFP reporter (A) or in the second temporal window with the RFP reporter (B). (C) P10 cortical sections of control (left panel) or overexpressing Cyclin D1 in the first (T1) or second (T2) temporal window. Dashed line: limit between upper (L2-4) and lower layers (L5-6). (D) Violin plots represent layer distribution of neurons labeled by each color reporter in control and manipulated neurons. CD1, Cyclin D1. n = 3. Scale bars, 100 μm. We found a significant shift in layer distribution for RFP+ (∗∗p < 0.01) and YFP+ (∗p < 0.05) neurons from upper to lower layers after Cyclin D1 overexpression in T2 (a two-tailed unpaired Student’s t test was used). (E) P10 cortical sections of control (left panel) or overexpressing Cyclin B1 in T1 or T2. (F and G) Violin plots represent the change in astrocyte (F) or neuron (G) numbers (normalized to the maximum for each color reporter) in control or manipulated samples. CB1, Cyclin B1. n = 3. Scale bars, 100 μm. We found a significant increase in astrocytes labeled CFP+ or RFP+ when overexpressing Cyclin B1 in T1 or T2, respectively (∗p < 0.05) (a two-tailed unpaired Student’s t test was used). (H) Summary of results obtained: apical progenitors (gray cells) generate neurons that colonize the cortex in an “inside-out” fashion. Control samples (black arrows): Early-born CFP+ neurons occupy lower layers, later-born RFP+ neurons mostly occupy upper layers and the latest-born YFP+ occupy upper layers and produce astrocytes. Overexpression of Cyclin D1 (orange arrows) shifts neuron distribution to lower layers in the corresponding temporal window and subsequent window (indirect effect—dashed line). Overexpression of Cyclin B1 (green arrows) increases the number of astrocytes in the corresponding temporal window. |
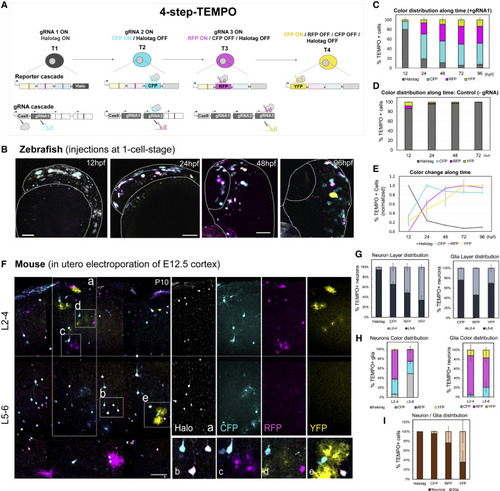
Extending the color cascade to increase temporal resolution with 4-step-TEMPO (A) Two modified TEMPO transgenes enable the ordered activation of a 4-reporter sequence (Halotag-CFP-RFP-YFP, T, temporal windows) by a parallel conditional gRNA cascade. (B) Co-injection of two integrative ubiquitous constructs (4-step-TEMPO and Cas9-gRNA switches) into zebrafish embryos and imaging between 12 and 96 hpf. Scale bars, 25 μm. (C and D) Changes in TEMPO color distribution (percentage of fluorescent cells for each color reporter along time).12 h, n = 4; 24 h, n = 10; 48 h, n = 8; 72 h, n = 6; 96 h, n = 6, error bars represent SEM. In the absence of the trigger gRNA (D), we observe a proportion of RFP+ and YFP+ cells (<2.5%), probably due to the leakiness of the gRNA switches (gRNA2 and gRNA3) in the absence gRNA1. (E) Normalization of the data shown in (C) to the maximum fluorescence for each reporter along time. (F) P10 mouse brain sections electroporated with the two modified 4-step-TEMPO constructs at E12.5. Dashed line: limit between upper (L2-4) and lower layers (L5-6). Insets: TEMPO+ lower layer neurons expressing Halotag and CFP (B) or RFP+ astrocytes (C), CFP+ and RFP+ upper layer neurons (D), or YFP+ astrocytes (E). (G) Layer distribution of TEMPO+ neurons (left) or glia (right). (H) Percentage of neurons (left) or glia (right) expressing each TEMPO reporter in the upper (L2-4) or lower (L5-6) layers. (I) Neuron and glia ratio for each reporter. Data are represented as percent ± SEM. n = 3, Scale bars, 100 μm. |