
- Title
-
Myostatin is a negative regulator of adult neurogenesis after spinal cord injury in zebrafish
- Authors
- Saraswathy, V.M., Zhou, L., McAdow, A.R., Burris, B., Dogra, D., Reischauer, S., Mokalled, M.H.
- Source
- Full text @ Cell Rep.

mstnb expression is induced in dorsal Sox2+ progenitors during SC regeneration
(A) Immunostaining for phosphorylated Smad3 (pSmad3) after SCI. Wild-type SC sections at 7, 14, and 21 dpi and uninjured controls are shown. Cross-sections 450 μm from the lesion are shown. A horizontal dotted line at the center of the central canal demarcates dorsal (D) and ventral (V) SC domains throughout the study. Arrows point to pSmad3+ nuclei in D SC domains. (B) pSmad3 quantification in D sections of wild-type SCs. The proportions of pSmad3+ cells (percent) were normalized to the total number of nuclei for each section. (C) pSmad3 and Sox2 immunostaining in wild-type SCs at 7 dpi. Single-channel micrographs are shown in high-magnification views. Arrowheads point to pSmad3+ Sox2+ progenitors. (D) pSmad3 quantification in D Sox2+ progenitors. The proportions of pSmad3+ Sox2+ cells (percent) were normalized to the numbers of pSmad3+ cells for each section. (E-G) mstnb expression in wild-type SC sections after SCI. mstnb fluorescence in situ hybridization was followed by immunostaining for Sox2 or HuC/D antibodies. mstnb quantifications in DSC tissues are shown in (E). For these quantifications, the integrated density of mstnb+ signals was quantified for each section and averaged across animals. Cross-sections 450 μm from the lesion are shown at 7, 14, and 21 dpi and for uninjured controls in (F). Arrows in (F) point to domains of mstnb expression in D SCs. Dotted ovals delineate central canal edges. High-magnification views of D progenitor domains at 7 dpi are shown in (G). For all quantifications, SC sections 450 μm rostral to the lesion were analyzed. Sample sizes represent the number of animals quantified and are indicated in parentheses. Error bars depict SEM, and statistical significance was determined by one-way ANOVA. *p < 0.05, **p < 0.01. Scale bars, 50 μm (A–F) and 10 μm (G). |

mstnb is required for recovery of swim function after SCI
(A) Experimental pipeline to examine regeneration phenotypes after SCI. (B) Swim endurance assays determined baseline motor function for uninjured mstnb−/+, mstnb−/−, and wild-type fish. (C) Swim endurance assays for mstnb−/+, mstnb−/−, and wild-type fish at 14, 28, and 42 dpi. Statistical analyses of swim times are shown for mstnb−/+ (gray) and mstnb−/− (magenta) relative to wild types. Recovery of mstnb−/− animals was not significantly different between 14 and 42 dpi. (D–F) Swim behavior assays assessed the performance of mstnb−/+, mstnb−/−, and wild-type siblings at minimal water current velocity. Average Y position in the tunnel (D), percent activity (E), and burst frequency (F) were quantified at 10 cm/s water current velocity. mstnb−/+, mstnb−/−, and wild-type fish are shown at 14, 28, and 42 dpi. Statistical analyses of swim times are shown for mstnb−/+ (gray) and mstnb−/− (magenta) relative to wild types. Two independent experiments are shown. (G) Glial bridging in mstnb−/− (magenta) and wild-type siblings (gray) at 14 dpi. Representative immunohistochemistry shows the Gfap+ bridge at the lesion site. Percent bridging represents the cross-sectional area of the glial bridge at the lesion site relative to the intact SC. Percent bridging was quantified for 5–7 animals per group. (H) Anterograde axon tracing in mstnb−/− (magenta) and wild-type zebrafish (gray) at 28 dpi. The biocytin axon tracer was applied rostrally and analyzed at 500 μm (proximal) and 1,500 μm (distal) caudal to the lesion. Axon growth was normalized to biocytin labeling in wild-type controls at the proximal level. Quantification represents 7–9 animals per group. (I) Retrograde axon tracing in mstnb−/− (magenta) and wild-type zebrafish (gray) at 21 dpi. The biocytin axon tracer was applied caudally, and biocytin-labeled neuronal cell bodies were analyzed 150 μm (proximal) and 450 μm (distal) rostral to the lesion. Dots represent individual animals from 2 or 3 independent clutches, and error bars depict SEM. Quantification represents 8–9 animals per group. *p < 0.05; **p < 0.01; ***p < 0.001; ns, p > 0.05. Scale bars, 50 μm. |

Cell proliferation in mstnb mutant zebrafish
(A) Experimental timeline to assess the rates of cell proliferation. mstnb−/− and wild-type siblings were subjected to SC transections. Animal numbers are indicated for each genotype, and two independent replicates are shown. (B and C) Immunohistochemistry for EdU, HuC/D, and Sox2 in SC sections of mstnb+/+ and mstnb−/− at 7 dpi. EdU and HuC/D colocalization is shown in (B). EdU and Sox2 colocalization is shown in (C). Dotted ovals delineate central canal edges. Regions in the rectangular boxes are shown at high magnification. Arrowheads indicate HuC/D>+ EdU>+ neurons in (B) and Sox2+ EdU>+ progenitors in (C). (D) Regenerated HuC/D>+ EdU>+ neurons were quantified in D SC sections at 7, 14, or 21 dpi and uninjured controls. Cross-SC sections 450 μm rostral to the lesion site were quantified. The proportions of HuC/D>+ EdU>+ neurons (%) were normalized to the numbers of HuC/D>+ neurons for each section. (E) Sox2+ EdU>+ progenitors were quantified in D SC sections at 7, 14, or 21 dpi and uninjured controls. Cross-SC sections 450 μm rostral to the lesion site were quantified. The proportions of Sox2+ EdU>+ progenitors were normalized to the numbers of Sox2+ progenitors for each section. Error bars depict SEM, and statistical significance was determined by two-way ANOVA. ANOVA p values and multiple-comparisons p values are indicated. **p < 0.01; ns, p > 0.05. Scale bars, 50 μm. |

Regenerative adult neurogenesis in mstnb mutant zebrafish
(A) Experimental timeline to assess the rates of neuronal differentiation and progenitor self-renewal. Animal numbers are indicated for each genotype, and two independent replicates are shown. (B) Immunohistochemistry for EdU (magenta), Sox2 (green), and HuC/D (blue) in SC sections of mstnb+/+ and mstnb−/− at 14 dpi. Regions in the rectangular boxes are shown at high magnification. Arrowheads indicate HuC/D>+ EdU>+ neurons or Sox2+ EdU>+ progenitors. (C) Regenerated HuC/D>+ EdU>+ neurons were quantified in D SC sections at 14 dpi. The proportions of HuC/D>+ EdU>+ neurons (%) representthe numbers of HuC/D+ EdU+ neurons normalized to the total numbers of nuclei for each section. (D) HuC/D>+ neurons were quantified in D SC sections at 14 dpi. The proportions of HuC/D>+ neurons (%) represent the numbers of HuC/D>+ neurons normalized to the total numbers of nuclei for each section. (E) Sox2+ EdU>+ progenitors were quantified in D SC sections at 14 dpi. The proportions of Sox2+ EdU>+ progenitors (%) represent the numbers of Sox2+ EdU>+ progenitors normalized to the total numbers of nuclei for each section. (F) Sox2+ progenitors were quantified in D SC sections at 14 dpi. The proportions of Sox2+ progenitors represent the numbers of Sox2+ progenitors normalized to the total numbers of nuclei for each section. Error bars depict SEM, and statistical significance was determined by two-way ANOVA. ANOVA p values and multiple-comparisons p values are indicated. *p < 0.05; ns, p > 0.05. Scale bars, 50 μm. |

Assessment of neuronal progenitors and subtypes in mstnb mutant zebrafish
(A) Experimental timeline to elucidate different steps of adult neurogenesis. (B) GFP staining in dbx1b:GFP;mstnb−/− SC sections at 14 dpi. dbx1b:GFP;mstnb+/+ siblings were used as controls. Dotted ovals delineate central canal edges. Regions in the rectangular boxes are shown at high magnification. (C and D) The numbers of dbx1b+ iNPs (#) were quantified in D SC sections 450 μm rostral to the lesion (C). The proportions of dbx1b+ iNPs (%) represent the numbers of dbx1b+ iNPs normalized to the total numbers of nuclei for each section (D). (E) GFP staining in s/c6a5:GFP:GFP;mstnb−/− SC sections at 14 dpi. slc6a5:GFP:GFP;mstnb+/+ siblings were used as controls. Dotted ovals delineate central canal edges. Regions in the rectangular boxes are shown at higher magnification. (F and G) The numbers of glycinergic s/c6a5:GFP+ neurons (#) were quantified in D SC sections 450 μm rostral to the lesion (F). The proportions of slc6a5:GFP+ neurons (%) represent the numbers of slc6a5:GFP+ neurons normalized to the total numbers of nuclei for each section (G). Dots represent individual animals from 2 independent clutches. For all quantifications, cross-SC sections 450 μm rostral to the lesion site were quantified. Error bars depict SEM, and statistical significance was determined by one-way ANOVA. Multiple-comparisons p values are shown. *p < 0.05; ns, p > 0.05. Scale bars, 50 μm. |
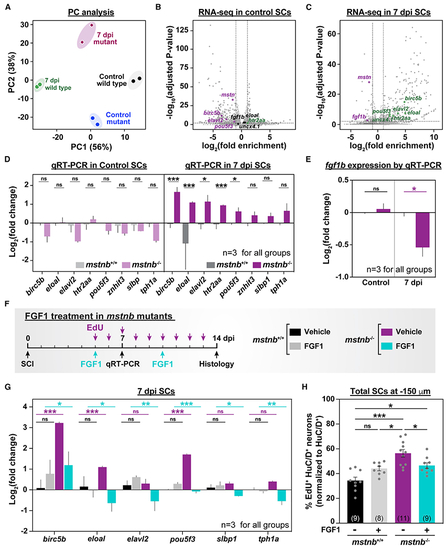
mstnb regulates neuronal differentiation after SCI via fgf1b
(A) mstnb−/− and wild-type siblings were subjected to complete SC transections and collected at 7 dpi for RNA-seq. Control SC tissues were collected from uninjured fish. Sequencing was performed in independent duplicates from separate fish clutches. Principal-component analysis shows clustering of biological replicates. Principal components 1 and 2 (PC1 and PC2, respectively) show 56% and 38% variance, respectively. (B and C) Volcano plot representation of genes that are significantly upregulated or downregulated in mstnb−/− SCs relative to wild-type controls. Upregulated genes include genes with log2(fold enrichment) > 1 and adjusted p < 0.01. Downregulated genes include transcripts with log2(fold enrichment) < −1 and adjusted p < 0.01. Selected upregulated (green) and downregulated (magenta) neuronal genes are indicated. Unchanged genes are labeled in black. (D) qRT-PCR for neuronal genes was performed on mstnb−/− and wild-type SCs at 7 dpi. Uninjured mstnb−/− and wild-type controls were used. For each time point, log2(fold change) was normalized to eif1α and to gene expression levels in mstnb+/+ controls. (E) fgf1b qRT-PCR was performed on uninjured and injured mstnb−/− and wild-type animals. For each time point, fgf1b expression was normalized to eif1α as a loading control and to fgf1b levels in mstnb+/+ controls. (F) Experimental timeline for human recombinant FGF1 treatment in mstnb−/− animals. (G) Neuronal gene expression was analyzed by qRT-PCR from FGF1- and vehicle-treated SC tissues at 7 dpi. For each gene, log2(fold change) was normalized to eif1α as a loading control and to gene expression levels in uninjured mstnb+/+ SCs. (H) HuC/D and EdU staining was performed on vehicle- and FGF1-treated mstnb−/− and wild-type animals. The numbers of regenerating HuC/D>+ EdU>+ neurons were quantified in SC cross sections 150 μm rostral to the lesion site. The proportions of HuC/D>+ EdU>+ neurons (%) were normalized to the numbers of HuC/D>+ neurons for each section. Dots represent individual animals from 2 independent clutches. Error bars depict SEM, and statistical significance was determined by one-way ANOVA. Multiple-comparisons p values are shown. ***p < 0.001; **p < 0.01; *p < 0.05; ns, p > 0.05. |