
- Title
-
Nox4 promotes osteoblast differentiation through TGF-beta signal pathway
- Authors
- Cao, Z., Liu, G., Zhang, H., Wang, M., Xu, Y.
- Source
- Full text @ Free Radic. Biol. Med.

Fig. 1. Zebrafish nox4 is highly conserved. (A) Alignment of the NOX4 amino acid sequences in human, mice, and zebrafish. The same amino acids are highlighted in dark blue. Ferric reductase-like transmembrane components (Ferric Reduct), FAD-binding domains (FAD-binding 8), and NAD-binding domains (NAD-binding 6) are marked with green, blue, and red boxes, respectively. (B) NOX4 protein sequence and position in human, mice, and zebrafish. (C) Homology analysis of nox4 in humans, mice, and zebrafish. The values represent the degree of genetic similarity between different species. (D) Conservative synteny analysis of nox4 in humans, mice, and zebrafish. The number next to the gene name represents the megabase pair (MBP) of the gene position on the chromosome. Chromosomes are represented by blue lines. Homologous fragments are connected by black lines. (For interpretation of the references to colour in this figure legend, the reader is referred to the Web version of this article.) |

Fig. 2. Construction of nox4−/− zebrafish. (A) The structure of zebrafish nox4 and the guide RNA (gRNA) site. The gRNA targets a sequence in exon 4. (B) Two homozygous mutant lines were obtained and identified by PCR. Lane 1: DNA marker; Lane 2: WT PCR product; Lane 2: PCR product from the −4 bp mutant; Lane 4: PCR product from the +142 bp mutant. (C) Nucleic acid sequences of two nox4 homozygous mutant lines showing a 4-bp deletion or a 142-bp increase in the homozygous mutants. (D) Sequencing map of nox4 mutant lines. |

Fig. 3. Bone mineralization in nox4 −/− zebrafish is disrupted during early development. (A, C, E) WT and nox4 −/− zebrafish were stained with alizarin red at 9, 15, and 30 days postfertilization (dpf). Dorsal and lateral views of representative larvae are shown. The red arrows illustrate changes in bone growth.(B, D, F) Quantification of the alizarin red-stained area at 9, 15, and 30 dpf. (G) μCT analysis of WT and nox4 −/− zebrafish at 60 dpf. (H) Bone parameters in WT and nox4 −/− zebrafish. PS: parasphenoid bone; OC: occipital bone; N: notochord; OP: operculum; O: otolith; BV/TV: bone volume fraction; BS/BV: bone surface area to bone volume; Tb.Th: trabecular thickness; Tb.Sp: trabecular separation. The scale bars in panels A, C, E are 200 μm,and in panels G is 500 μm n = 10. The data were analyzed using one-way ANOVA. *P < 0.05, **P < 0.01, and ***P < 0.001. (For interpretation of the references to colour in this figure legend, the reader is referred to the Web version of this article.) |
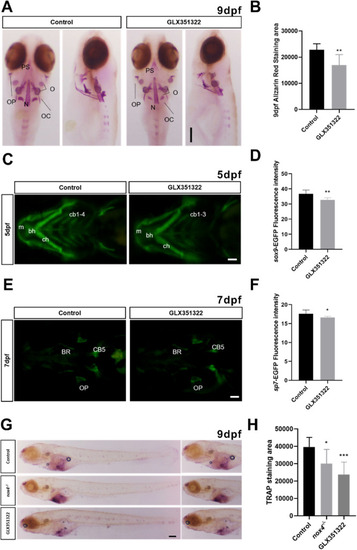
Fig. 4. Treatment with Nox4 inhibitor GLX351322 reduces bone mineralization in early development. (A) WT zebrafish were treated with GLX351322 at 8 hpf. Tissue was collected at 9 days postfertilization (dpf) and stained with alizarin red. Dorsal and lateral views of larvae are shown. (B) Quantification of alizarin red staining. (C) Tg(sox9-EGFP) zebrafish were treated with GLX351322 at 8 hpf and fluorescence intensity was assessed at 5 dpf. (D) Quantification of green fluorescence in chondrocytes. (E) Tg(sp7-EGFP) zebrafish were treated with GLX351322 at 8 hpf and fluorescence intensity was observed at 7 dpf. (F) Quantification of green fluorescence in osteoblasts. (G) WT zebrafish were treated with GLX351322 at 8 hpf. Samples were collected at 9 dpf for TRAP staining. (H) Quantification of TRAP-stained area. m: Meckel's cartilage; bh: basihyoid bone; cb: ceratobranchial bone; ch: ceratohyal bone; PS: parasphenoid bone; OC: occipital bone; N: notochord; BR: branchial ray; OP: operculum; O: otolith. The scale bars in panels A, C, E, and G indicate 200 μm n = 10. The results were analyzed using one-way ANOVA. *P < 0.05, **P < 0.01, and ***P < 0.001. (For interpretation of the references to colour in this figure legend, the reader is referred to the Web version of this article.) |

Fig. 5. Nox4 loss reduces tail regeneration. (A) Alizarin red and (B) TRAP staining were performed 3, 6, 10, and 13 days postamputation (dpa). The figures show the front view and an enlarged view of the tail. (C) Regeneration length in WT and nox4 −/− tails at different growth stages. (D) Quantification of TRAP staining in WT and nox4 −/− zebrafish tail at different growth stages. (E) Tg(sp7-EGFP) zebrafish were treated with GLX351322 and fluorescence was observed at 6 dpa. The panels show the front view and an enlarged view of the tail. (F) Quantification of green fluorescence in osteoblasts. n = 6. The scale bars in panels A, B, E are 200 μm.The results were analyzed using one-way ANOVA. *P < 0.05, **P < 0.01, and ***P < 0.001. (For interpretation of the references to colour in this figure legend, the reader is referred to the Web version of this article.) |
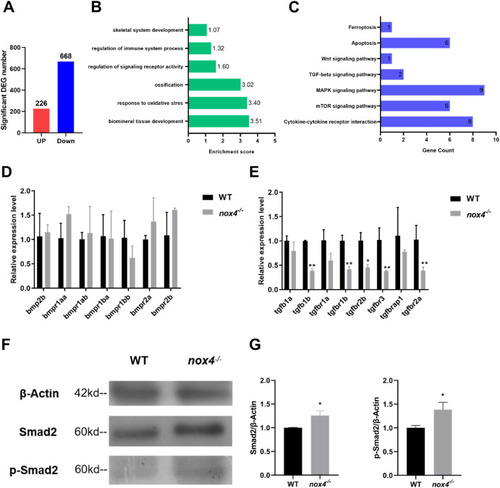
Fig. 6. TGF-β signaling is dysregulated in nox4 −/− zebrafish. (A) WT and nox4 −/− transcriptomes were sequenced 9 days postfertilization (dpf) to identify differentially expressed genes. Up indicates upregulated genes and down indicates downregulated genes. (B) The differentially expressed genes were used for gene ontology (GO) analysis. The x-axis shows the enrichment fraction and the y-axis indicates the biological process. (C) The differentially expressed genes were used for Kyoto encyclopedia of genes and genes (KEGG) enrichment analysis. The x-axis shows the number of enriched genes in each pathway and the y-axis shows the signal pathway. (D, E) RT-qPCR analysis of Bmp, Tgf-β, and their receptor gene expression in WT and nox4−/− zebrafish. (F) Western blot of Smad2 and p-Smad2 protein expression downstream of TGF-β signaling pathway in WT and nox4−/− zebrafish. (G) Quantification of β-actin, Smad2, and p-Smad2 bands in WT and nox4−/− zebrafish. The results were analyzed using one-way ANOVA. *P < 0.05, **P < 0.01, and ***P < 0.001. |

Fig. 7. Blocking TGF-β signaling rescues bone dysplasia caused by Nox4 loss in early development. (A) Nine days postfertilization (dpf), WT, nox4−/−, and nox4−/− zebrafish treated with SB431542 were stained with alizarin red. The figures show the front view and an enlarged view of the tail. (B) Quantification of alizarin red staining in WT, nox4−/−, and nox4−/− zebrafish treated with SB431542 9 dpf. (C) At 8 dpf, Tg(sp7-EGFP) fluorescence in the control, GLX351322, and GLX351322 + SB431542 treatment groups was observed. (D) Quantification of Tg(sp7-EGFP) fluorescence in the control, GLX351322, and GLX351322 + SB431542 groups. (E) At 9 dpf, TRAP staining was performed on WT, nox4−/−, and nox4−/− zebrafish treated with SB431542. The upper panels show the lateral view and the lower panels show an enlarged view. (F) Quantification of TRAP staining. CB: ceratobranchial bone; PS: parasphenoid bone; OC: occipital bone; N: notochord; BR: branchial ray; OP: operculum; O: otolith. n = 10. The scale bars in panels A, C, E are 200 μm. The results were analyzed using one-way ANOVA. *P < 0.05, **P < 0.01, and ***P < 0.001. (For interpretation of the references to colour in this figure legend, the reader is referred to the Web version of this article.) |

Fig. 8. Treatment with GLX351322 impairs Saos-2 cell proliferation and differentiation. (A) After culture for 12 days, alizarin red staining was performed in control, induced, and GLX351322-treated/induced cells. (B) Saos-2 cells in the control, induction, and induction + GLX351322 groups from days 1–4, 5–8, and 9–12, respectively, were stained with alizarin red on culture day 12. (C) RT-qPCR was used to analyze Runx2, Osx, and Ocn expression in Saos-2 cells treated with GLX351322 from days 1–4, 5–8, and 9–12. (D) Cells in the control, induction, GLX351322 + induction, and GLX351322 + SB431542 + induction groups were stained with alizarin red after 12 days of culture. The results were analyzed using two-way ANOVA. *P < 0.05, **P < 0.01, and ***P < 0.001. (For interpretation of the references to colour in this figure legend, the reader is referred to the Web version of this article.) |
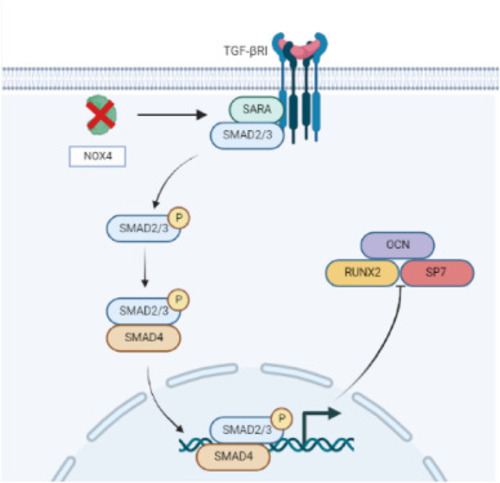
Fig. 9. The role of Nox4 in early skeletal development of zebrafish. In nox4−/− zebrafish, TGF-β/p-Smad2 signaling decreases, leading to decreased expression of the osteogenic differentiation-related genes RUNX2, OSX, and OCN in osteoblasts. This may be one reason for osteogenic defects in nox4−/− zebrafish. |
Reprinted from Free radical biology & medicine, 193(Pt 2), Cao, Z., Liu, G., Zhang, H., Wang, M., Xu, Y., Nox4 promotes osteoblast differentiation through TGF-beta signal pathway, 595-609, Copyright (2022) with permission from Elsevier. Full text @ Free Radic. Biol. Med.