FIGURE SUMMARY
Title

Effect of Polydeoxyribonucleotide (PDRN) Treatment on Corneal Wound Healing in Zebrafish (Danio rerio)

Authors
Edirisinghe, S.L., Nikapitiya, C., Dananjaya, S.H.S., Park, J., Kim, D., Choi, D., De Zoysa, M.
Source
Full text @ Int. J. Mol. Sci.

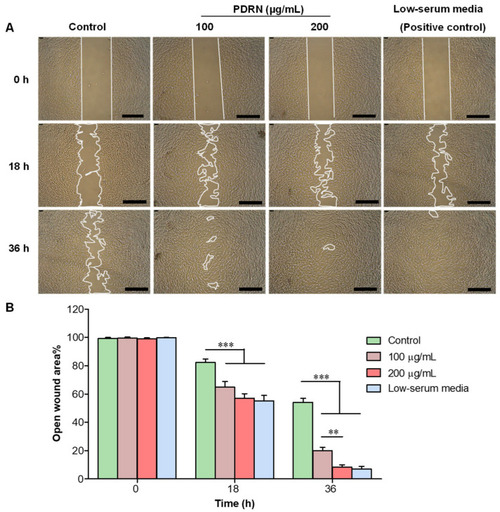
Effect of PDRN on in vitro wound healing in HDFs. (A) Representative images of in vitro scratch assay, and (B) quantification of cell-free area of HDFs upon PDRN treatment (100 and 200 µg/mL) at 0, 18, and 36 h. Results are presented as means ± standard deviation (SD) based on the time point at 0 h (Two-way ANOVA, ** p < 0.01, *** p < 0.001, Scale bar 500 µm, n = 3).

Examination of PDRN effect on corneal re-epithelialization upon acetic acid injury. (A) The representative photographs of fluorescein-stained zebrafish eye of the control and the acid injury groups. (B) The chemical structure of fluorescein sodium salt. (C) The time-dependent fluorescence intensity change at the injury site of the eye and (D) quantification of the relative fluorescence intensity of cornea-injured PDRN- and vehicle-treated groups. Data are presented as the mean ± standard deviation (SD). Student’s two-tailed t-test was performed to find statistical significance, * p < 0.05 for the PDRN group vs. the vehicle group (n = 16).

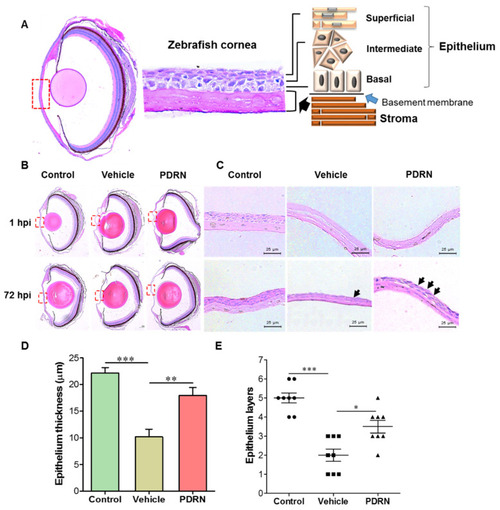
Histological analysis of zebrafish eye and corneal re-epithelialization following the corneal injury and PDRN treatment. (A) Representative image of H&E stained zebrafish eye, cornea, and graphical illustration of the corneal epithelium. (B) Representative photograph of the whole eye of un-injured (negative control), cornea-injured vehicle, and cornea-injured PDRN-treated groups (scale bars, 40 μm), and (C) photographs of selected central epithelium surface of the cornea (scale bars, 200 μm.) at 1 and 72 hpi. Regenerated epithelial cell layers were marked with black arrows. Quantification of corneal regeneration based on (D) epithelium thickness, and (E) number of epithelium cell layers at 72 hpi. One-way ANOVA was performed to determine the statistical significance; * p < 0.05, ** p < 0.01, *** p < 0.001 (n = 8).

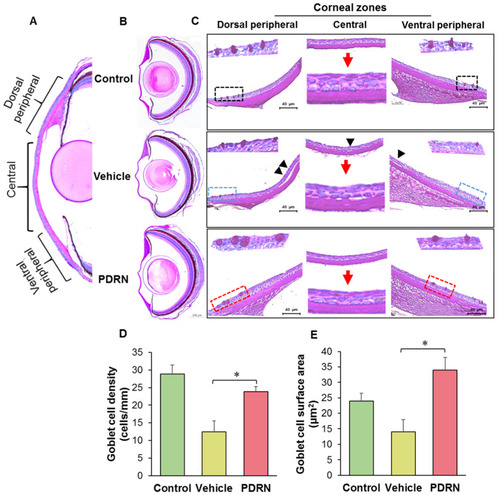
PDRN effect on goblet cell characteristics in the corneal epithelium following the cornea injury and PDRN treatment. (A) Magnified transverse sections stained with PAS showing the representative panoramic overview of three corneal epithelial zones (dorsal peripherals, central, and ventral peripheral) and matured goblet cells at 72 hpi after the cornea injury (Scale bars, 200 μm). (B) Images showing the mature goblet cells (red square) in the PDRN-treated group, and (C) magnified zones showing that the epithelium cells are not well attached (black arrowheads) in the cornea- injured vehicle-treated group. The graphs illustrate quantification of (D) goblet cell density and (E) the goblet cell surface area (an indicator of size) following the cornea injury at 72 hpi. Goblet cell density was measured as the number of cells/mm of corneal surface (one-way ANOVA was performed to find statistical significance; * p < 0.05, n = 8).

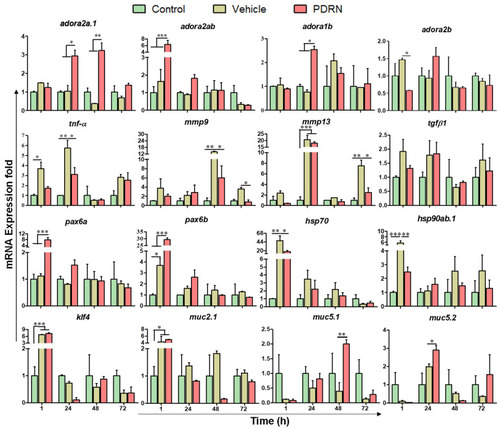
Transcriptional profiles of wound healing related genes in zebrafish eye upon cornea injury and PDRN treatment. The data are presented as fold changes over un-injured, cornea injury vehicle-treated, and cornea injury PDRN-treated. Three samples (R = 3) were collected from the right-side eye of nine adult fish for each condition, and two independent experiments were performed (two-way ANOVA followed by Dunnett’s post hoc test was performed to find statistical significance; * p < 0.05, ** p < 0.01, *** p < 0.001).

Immunoblot analysis of Mmp-9, Hsp70, and Tnf-α in response to corneal injury and PDRN treatment in zebrafish eye. (A) Western blot analysis images representing the specific protein bands that were expressed against the selected antibodies. (B) The pixel intensity of each protein band was quantified using Chemi Doc (Fusion Solo, Vilber, Lourmat, France) and normalized to β-actin. The relative expression fold was calculated based on the control group of each time point (one-way ANOVA was performed to find statistical significance; * p < 0.05; ** p < 0.01).

Acknowledgments
This image is the copyrighted work of the attributed author or publisher, and ZFIN has permission only to display this image to its users. Additional permissions should be obtained from the applicable author or publisher of the image. Full text @ Int. J. Mol. Sci.