
- Title
-
Extracellular fluid viscosity enhances cell migration and cancer dissemination
- Authors
- Bera, K., Kiepas, A., Godet, I., Li, Y., Mehta, P., Ifemembi, B., Paul, C.D., Sen, A., Serra, S.A., Stoletov, K., Tao, J., Shatkin, G., Lee, S.J., Zhang, Y., Boen, A., Mistriotis, P., Gilkes, D.M., Lewis, J.D., Fan, C.M., Feinberg, A.P., Valverde, M.A., Sun, S.X., Konstantopoulos, K.
- Source
- Full text @ Nature

Viscosity enhances cell migration and promotes an ARP2/3-mediated dense actin network at the leading edge.
a,b, Speeds of MDA-MB-231 cells (a) and other indicated cell types (b) inside confining channels at prescribed viscosities. The red lines represent the median of ≥69 cells from ≥3 experiments. c, Cell trajectories on 2D collagen-coated surfaces after 10 h. d, Cells disseminating from 3D spheroids. e, The time required for the first cell dissociation from each spheroid (n ≥ 53) from 3 experiments. f, Airyscan images of phalloidin stained cells on collagen-coated substrates. The red arrow indicates high F-actin staining along the cell edge. g, The fraction of cell-projected area with a Lifeact–GFP-rich lamella for n ≥ 28 cells from 3 experiments. h, The leading edge of Lifeact–GFP-expressing cells on collagen-coated surfaces at t = 0 min (red) and t = 2 min (cyan) (left). Right, leading-edge lamella growth in n ≥ 19 cells from 3 experiments. Data are the moving average ± s.e.m. P < 0.05 for all points t ≥ 50 s. Time is shown as min:s. i,j, STORM reconstruction (i) and density quantification (j) of F-actin for cells (n ≥ 13) on substrates from 2 experiments. k, The average actin density over time from 20 stochastic simulations. Viscous forces were applied at t = 6 s (red arrow) and maintained until the end of the simulation. l, Confocal images of cells expressing Lifeact–GFP and ARP3–mCherry in confinement. The red arrow indicates high ARP3 intensity at leading-edge protrusions at 8 cP. m, The relative ARP3–mCherry intensity along normalized cell length in confined cells. Data are the moving average ± s.e.m. for n = 21 cells from 4 experiments. ***P < 0.001 for all comparisons at normalized cell length > 0.96. The x axis is discontinued between 0.25 and 0.75 to highlight differences at the cell edges. n, Confined migration speeds of SC versus ARP3/ARPC4 double-knockdown cells (n = 90) from 3 experiments. For e, g, j and n, data are mean ± s.d. Unless otherwise indicated, statistical comparison was performed with respect to 0.77 cP. Statistical analysis was performed using Kruskal–Wallis tests followed by Dunn’s test (a and n), Mann–Whitney U-tests (BrM2 only) or unpaired t-tests after log-transformation (other cells) (b), unpaired t-tests (e, g and j) and two-way analysis of variance (ANOVA) followed by Šidák’s test (h and m). Scale bars, 250 μm (c), 50 μm (d), 25 µm (f, white), 3 µm (f, red), 10 µm (h), 2 µm (i), 20 µm (l). The cell model was MDA-MB-231 unless otherwise indicated. *P < 0.05, **P < 0.01, ***P < 0.001, ****P < 0.0001. Source data |

Viscosity promotes NHE1-dependent cell swelling, which activates TRPV4 leading to calcium influx.
a, The volume of Lifeact–GFP-labelled MDA-MB-231 cells (n ≥ 28) at the indicated viscosities from 3 experiments. b, Confocal images of confined MDA-MB-231 cells stained for NHE1 and phalloidin. c, Front-to-rear NHE1 intensity ratio in NHE1-immunostained cells (n ≥ 16) from 3 experiments. d, The rate of pH recovery in pHRed-expressing MDA-MB-231 cells (n ≥ 29) from 5 experiments. e, The volume of SC and shNHE1 Lifeact–GFP-tagged MDA-MB-231 cells (n ≥ 36) from 3 experiments. f, Confined migration speeds of SC and shNHE1 MDA-MB-231 cells (n ≥ 113) from 3 experiments compared with the two-phase model predictions. g, The elevated Flipper-TR lifetimes in MDA-MB-231 cells on 2D surfaces indicate high membrane tension. h, The membrane tension in wild-type MDA-MB-231 cells after treatment with vehicle (veh.), CK666 or EIPA, and in SC or shTRPV4 cells (n ≥ 58) from 3 experiments. i, The number of calcium flashes in SC, shTRPV4 or shNHE1 MDA-MB-231 cells (n ≥ 52) on 2D surfaces from 3 experiments. j,l, TRPV4 currents (I) in SC- and shTRPV4 (j) or shNHE1 (l) MDA-MB-231 cells (n ≥ 3) with or without the TRPV4 inhibitor HC-067047 from ≥3 experiments. k, Confined migration speeds of SC and shTRPV4 MDA-MB-231 cells (n ≥ 129) from 3 experiments. m, The time required for the first cell dissociation from each spheroid (n ≥ 57) after treatment with vehicle control or the TRPV4 inhibitor GSK 2193874 (GSK2) from 3 experiments. n, The number of calcium flashes in MDA-MB-231 cells (n ≥ 29) treated with the ARP2/3 inhibitor CK666 from 2 experiments. o, Confocal images of confined MDA-MB-231 cells stained for NHE1, ezrin and phalloidin. p, Front-to-rear NHE1 or ezrin intensity ratio from immunostained cells (n ≥ 24) from 2 experiments. Data are mean ± s.d. (a, c–f, h, i, k, m, n and p) and mean ± s.e.m. (j and l). Statistical analysis was performed using unpaired t-tests after log-transformation (a, c and d), one-way ANOVA followed by Tukey’s test after log-transformation (e and m), Kruskal–Wallis tests followed by Dunn’s test (f, h, i, k and n), one-way ANOVA followed by Holm–Šidák’s test (j and l) and Mann–Whitney U-tests (p). Scale bars, 20 µm (b and o) and 10 µm (g). Source data |
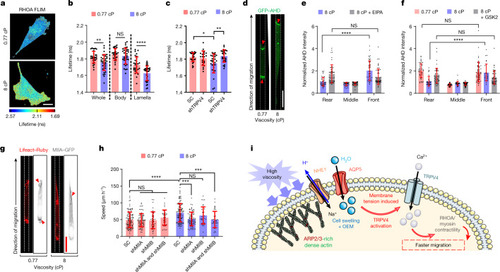
TRPV4-mediated activation of RHOA–ROCK–myosin II contractility.
a, The lifetimes of the RHOA activity biosensor in MDA-MB-231 cells on a 2D surface at the indicated viscosities. b, The subcellular distribution of RHOA activity in n ≥ 30 cells on a 2D surface from 4 experiments. c, RHOA activity in SC and shTRPV4 MDA-MB-231 cells (n ≥ 21) on a 2D surface from 3 experiments. d, Confocal images of GFP–AHD-expressing MDA-MB-231 cells in confinement. The red arrowheads indicate regions of active RHOA. e, GFP–AHD intensity in different segments of confined MDA-MB-231 cells (n ≥ 33) at 8 cP in the presence of vehicle control or NHE1 inhibitor from ≥3 experiments. f, GFP–AHD intensity in different segments of confined MDA-MB-231 cells (n ≥ 33) after treatment with vehicle control or the TRPV4 inhibitor GSK 2193874 (GSK2) from 3 experiments. The intensity in each segment was normalized to the mean intensity of the entire cell in e and f. g, Confocal images of MIIA–GFP-expressing and Lifeact–Ruby-expressing MDA-MB-231 cells migrating in confinement. The red arrowheads indicate regions of intense MIIA localization. h, The confined migration speeds of SC and MIIA and MIIB single- or double-knockdown MDA-MB-231 cells (n ≥ 38) from 2 experiments. Data are mean ± s.d. i, Schematic of the proposed viscosity-sensing pathway. OEM, osmotic engine model. The schematic in i was created using Servier Medical Art. Statistical analysis was performed using unpaired t-tests (b), Kruskal–Wallis tests followed by Dunn’s test (c and h) and two-way ANOVA followed by Tukey’s test (e and f). Scale bars, 20 µm (a, d and g). Source data |

MDA-MB-231 cells preconditioned to elevated viscosity exhibit enhanced migration, extravasation and lung colonization.
a, Illustration of cell preconditioning at the indicated viscosities. b, Confined migration speeds of preconditioned cells (0.77 or 8 cP for 6 days) resuspended at the indicated migration viscosity. Data are mean ± s.d. for n ≥ 140 cells from 3 experiments. c, The confined migration speeds of preconditioned SC or shTRPV4 cells allowed to migrate at 0.77 cP. Data are mean ± s.d. for n ≥ 146 cells from 3 experiments. d, Confocal image of 3 day post-fertilization (d.p.f.) zebrafish ISVs with measurements of vessel width (top). Bottom, experimental design of migration studies in zebrafish. e,f, Time-lapse confocal images (e) and average speeds (f) of preconditioned cells (n ≥ 77) inside ISVs from 3 experiments. The red lines indicate the median (thick) and quartiles (thin). g, The experimental design of mouse tail-vein experiments. h, The number of human vimentin-positive colonies in the lungs 48 h after injection. Data are mean ± s.e.m. for 8 mice per group from 2 experiments. i,j, Confocal images of lung sections (i) and quantification of human vimentin-positive metastatic colonies (j) 3 weeks after injection. Data are mean ± s.e.m. for a total of ≥7 mice per group from 2 experiments. k,l, The number of human vimentin-positive metastatic colonies in the lungs 48 h (k) and 3 weeks (l) after injection. Data are mean ± s.e.m. for ≥9 mice per group from 2 experiments. The squares represent experiments with PVP as the medium additive. m,n, qPCR detection of human DNA in the lungs of mice 48 h (m) or 3 weeks (n) after injection. Data are mean ± s.d. for ≥9 mice per group. Squares are from experiments with PVP. Statistical analysis was performed using Kruskal–Wallis tests followed by Dunn’s test (b and c), Mann–Whitney U-tests (f), unpaired t-tests (h and j), one-way ANOVA followed by Tukey’s test (l–n) and one-way ANOVA followed by Tukey’s test on log-transformed data (k). Scale bars, 20 µm (d), 30 µm (e) and 200 µm (i). The schematics in a, d and g were created using Servier Medical Art. Source data |