FIGURE SUMMARY
Title

Identification of key pharmacodynamic markers of American ginseng against heart failure based on metabolomics and zebrafish model

Authors
Dong, R., Zhang, Y., Chen, S., Wang, H., Hu, K., Zhao, H., Tian, Q., Zeng, K., Wang, S., Han, L.
Source
Full text @ Front Pharmacol

Comparison of the anti-heart failure activities of AG collected from different regions. (A) Diagram of drug treatment in the zebrafish heart failure experiment; (B) phenotypic micrograph of the zebrafish in the heart; (C) statistical results of the pericardial area of the zebrafish heart. n = 10; (D) statistical results of the venous congestion area of the heart in zebrafish. n = 10; (E) statistical results of SV–BA in the zebrafish hearts in all groups. n = 10; and (F) comparison of the improvement rate of heart failure of AG samples from different regions. Heart failure improvement rate = (A1+A2+A3)/3, A = (Φ-a)/Φ*100%, Φ: Mean values of the model groups, (A) values of sample groups; ##p < 0.01 vs. the control group; *p < 0.05 and **p < 0.01 vs. the model group.

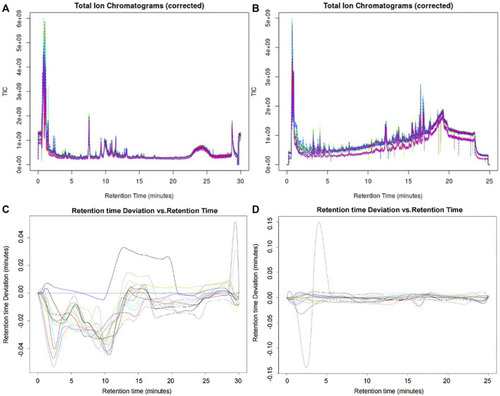
Superposition map of the total ion chromatograms of AG samples. (A) Corrected total ion chromatogram in the positive ion mode; (B) corrected total ion chromatogram in the negative ion mode; (C) retention time deviation diagram of the AG samples in the positive ion mode; and (D) retention time deviation diagram of the AG samples in the negative ion mode.

Multivariate statistical analyses of the metabolomic data of GF. (A) PCA scatter plot in the positive ion mode; (B) OPLA-DA scatter plot in the positive ion mode; (C) S-plots for the OPLA-DA in the positive ion mode; (D) PCA scatter plot in the negative ion mode; (E) OPLA-DA scatter plot in the negative ion mode; (F) S-plots for the OPLA-DA in the negative ion mode; and (G) MS2 spectra of ginsenoside Rg6.

Validation of the anti-heart failure activity of ginsenoside Rg3, ginsenoside Rg5, ginsenoside Rg6, malic acid, L-argininosuccinic acid, quinic acid, and pseudoginsenoside F11. (A–G) Statistical results of the pericardial area of the zebrafish. n = 10; (A’–G’) statistical results of the venous congestion area of the heart in zebrafish. n = 10; (A–G) statistical results of the SVBA distance in zebrafish hearts. n = 10. ##p < 0.01 vs. the control group,*p < 0.05 and **p < 0.01 vs. the model group.

C-T-P network of the anti-heart failure and molecular docking 2D diagram. (A–F) C-T-P network of ginsenoside Rg3, quinic acid, ginsenoside Rg6, pseudoginsenoside F11, malic acid, and ginsenoside Rg5; (A’–F’) molecular docking 2D diagram of the bioactive molecules; (A”–F”) molecular docking 2D diagram of positive molecules.

Effects of potential active compounds on heart failure-related gene expression. (A–F) Results of gene expression in zebrafish treated with ginsenoside Rg3, quinic acid, malic acid, ginsenoside Rg6, ginsenoside Rg5, and pseudoginsenoside F11, ##p < 0.01 vs. the control group,*p < 0.05 and **p < 0.01 vs. the model group.

Acknowledgments
This image is the copyrighted work of the attributed author or publisher, and ZFIN has permission only to display this image to its users. Additional permissions should be obtained from the applicable author or publisher of the image. Full text @ Front Pharmacol