
- Title
-
Effects of Dietary Supplementation with Aurantiochytrium sp. on Zebrafish Growth as Determined by Transcriptomics
- Authors
- Yang, H., Huang, Y., Li, Z., Guo, Y., Li, S., Huang, H., Yang, X., Li, G., Chen, H.
- Source
- Full text @ Animals (Basel)
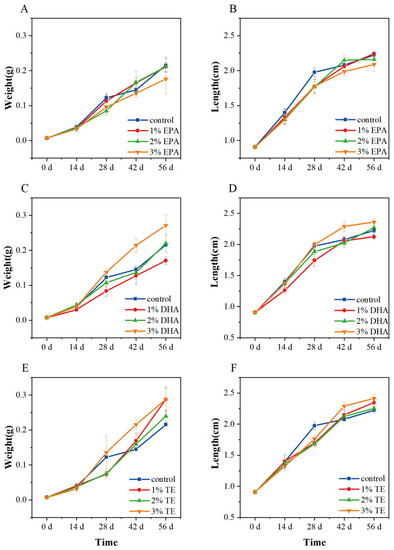
Effect of different diets on body weight and length of zebrafish. Growth data of dietary EPA group (A,B), dietary DHA group (C,D), and dietary TE group (E,F). Error bars indicate SEM (n = 9). EPA: eicosapentaenoic acid; DHA: docosahexaenoic acid; TE: Aurantiochytrium sp. extract. |
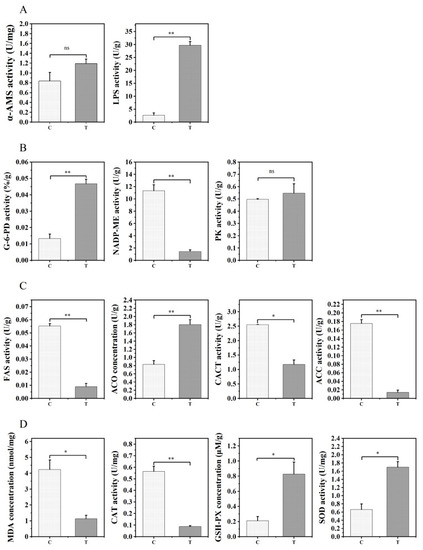
Comparative assessment of liver enzyme activities related to digestion (A), energy metabolism (B), lipid metabolism (C), and antioxidant defense (D) in the control group (C) and 1% TE group (T). Error bars indicate SEM (n = 9). Asterisks indicate significant differences between the two groups (* p < 0.05, ** p < 0.01), ns: not significant (p > 0.05) α-AMS: hepatic amylase; LPS: hepatic lipase; G-6-PD: dehydrogenase; NADP-ME: malic enzyme; PK: pyruvate kinase; FAS: fatty acid synthase; ACO: acetyl-CoA oxidase; CACT: carnitine lipid acyltransferase; ACC: acetyl-CoA; MDA: malondialdehyde; CAT: catalase; GSH–PX: glutathione peroxidase; SOD: superoxide dismutase. |
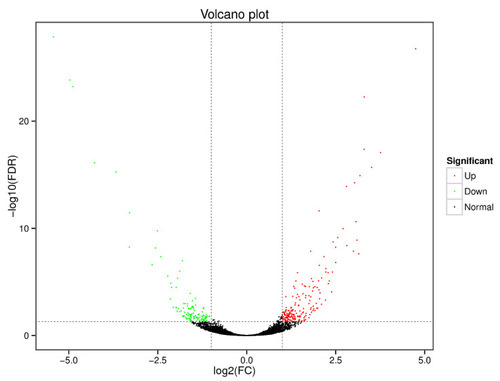
Volcano plot of differential gene expression in the zebrafish liver. Green dots represent down-regulated genes in the 1% Aurantiochytrium sp. extract group, red dots represent up-regulated genes, and black dots represent non-differentially expressed genes. Significance criteria were q < 0.05 and fold change ≥ 2. |
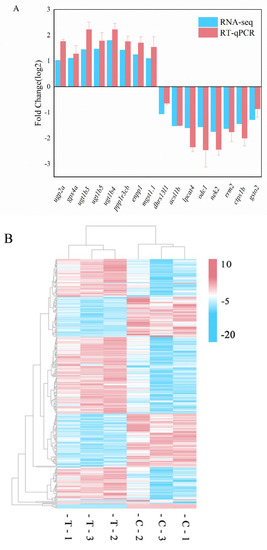
Validation of DEGs and clustering heatmap. (A) Validation of differential expression by RT-qPCR. Error bars indicate SEM (n = 3). (B) Cluster map of gene expression patterns demonstrating general patterns in distinct liver samples. (C) Correlation analysis of log2-fold change values between RNA-Seq data (x-axis) and RT-qPCR data (y-axis). |

Validation of DEGs and clustering heatmap. (A) Validation of differential expression by RT-qPCR. Error bars indicate SEM (n = 3). (B) Cluster map of gene expression patterns demonstrating general patterns in distinct liver samples. (C) Correlation analysis of log2-fold change values between RNA-Seq data (x-axis) and RT-qPCR data (y-axis). |

GO functional enrichment analysis of differentially expressed genes in the liver. Histograms of GO term enrichment in the (A) cellular component category, (B) molecular function category, and (C) biological process category. |

GO functional enrichment analysis of differentially expressed genes in the liver. Histograms of GO term enrichment in the (A) cellular component category, (B) molecular function category, and (C) biological process category. |
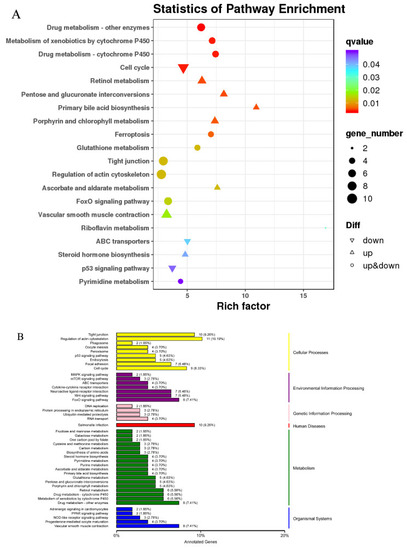
KEGG enrichment and classification. (A) Scatter plot of KEGG pathway enrichment results for differentially expressed genes: the ordinate represents the pathway name, the abscissa represents the enrichment factor, and the color represents the q-value (i.e., the p-value after correction for multiple hypothesis testing). The size of the circle indicates the number of genes involved in the pathway. (B) KEGG classification diagram: the left-hand vertical axis shows the KEGG pathway name, and the right-hand vertical axis shows the category corresponding to each pathway. A shared column color indicates the same category. |