
- Title
-
Zebrafish neuromesodermal progenitors undergo a critical state transition in vivo
- Authors
- Toh, K., Saunders, D., Verd, B., Steventon, B.
- Source
- Full text @ iScience

Heterogeneity in sox2 and tbxta expression and variability in the number and locations of NMps peak at 24ss (A) Zebrafish NMps undertake a binary fate decision to differentiate into the posterior neural and mesodermal fates. (B) 2D lateral slice showing sox2+tbxta+ nuclei (cyan surfaces) in the maturation zone. (B′) 2D medial slice showing sox2+tbxta+ nuclei in the hypochord, pNPD and PW. pNPD: posterior notochord progenitor domain; PW: posterior wall. (C–C″) Segmented NMp surfaces located in the (C) maturation zone (C′) PW (C″) pNPD. (D, E, and F–F′) Maximum intensity projections of tbxta and sox2 shown alongside segmented surfaces of the posterior notochord (D) and posterior neural tube (E). NMps are shown as points colored according to their (F) tbxta and (F′) sox2 expression levels. The red regions highlight the NMps in the posterior wall that co-express intermediate levels of (F′) tbxta and (F″) sox2, which is also highlighted with a red region in (J). (D′, E′, and F″) Histograms from 18ss to 30ss depicting the expression distributions of nuclear sox2 and tbxta distributions in the (D′) posterior notochord (E′) posterior neural tube (F′) NMp populations. Each ridge plot displays the expression distributions of the specified cell population across all analyzed samples. All three cell populations within a sample adopted the same Sox2 and Tbxta threshold value for min-max normalization (STAR methods: Quantification and normalization of nuclear gene expression intensities in NMps). (G–I″) HCR-stained samples at (G-G″) 18ss, (H–H″) 24ss and (I–I″) 30ss with three representative images per set. n: number of segmented NMps in each sample. (J) Scatterplots of sox2 and tbxta expression of NMps from 18ss to 30ssat three-somite intervals. Each point corresponds to the normalised nuclear sox2 and tbxta intensities of a single NMp. The red boxes at each stage highlight NMps with intermediate levels of both genes. (K) Box and whisker plots of the number of NMps from 18ss to 30ssat three-somite intervals. Each point corresponds to the number of NMps in a single sample. The median NMp number is indicated in bold. n: total number of samples analyzed for each stage (biological replicate). N: number of distinct imaging experiments, where different biological samples imaged on the same day are considered a single imaging experiment. Levene’s test for the equality of variance was carried out for the NMp numbers at 24ss against the other four timepoints. ∗pvalue < 0.01. |
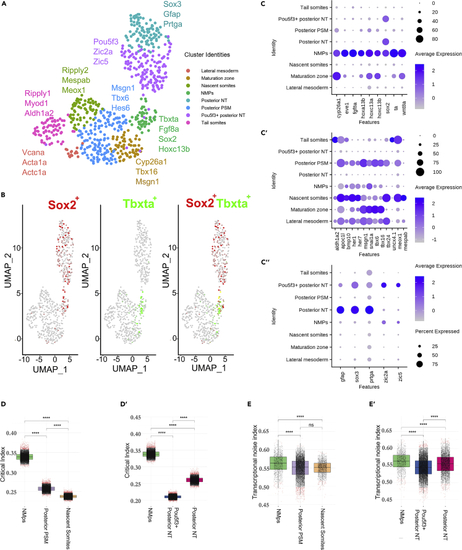
Analysis of 18ss scRNA-seq data reveals a peak in the critical index and transcriptional noise index in the NMp population relative to its derivatives (A) UMAP embedding showing the 8 tailbud clusters at 18ss alongside the key differentially expressed genes used for manual annotation. UMAP: uniform manifold approximation and projection. (B) UMAP embedding in (A) colored by sox2 and tbxta expression and sox2-tbxta together to illustrate co-expression (in yellow). (C–C″) Dot plots displaying the expression of differentially expressed genes from the tailbud (C) NMp cluster, (C′) Mesodermal clusters and (C″) Neural clusters. (D–D′) Distribution of the critical transition index Ic calculated using marker genes of each cluster along the mesodermal (D) and neural (D′) branches. A bootstrapping procedure was applied in calculating Ic to account for the differences in cell number between cell clusters. Wilcoxon-Mann-Whitney unpaired two-sample test ∗∗∗∗p value < 0.0001; ns, not significant. (E–E′) Distribution of pairwise cell-to-cell distances/transcriptional noise along the mesodermal (E) and neural (E′) branches. Wilcoxon-Mann-Whitney unpaired two-sample test ∗∗∗∗p value < 0.0001; ns, not significant. |

Gene expression imputation and the construction of a composite map via ZebReg demonstrates a peak in the NM index entropy at 24ss (A) Application of ZebReg for the imputation of multiple genes onto a target composite image. In the panel, tbxta, cdh6, hes6, tcf, depdc7a and wnt8a are imputed onto a target image that is stained only for sox2. sox2 is the common color channel used to assist the alignment of the source images onto the target image. In this example, the resultant target image has 7 distinct color channels. (B–B′) Coloring in silico NMps in the 18ss, 24 and 28ss composite maps by (B) sox2 expression (B′) tbxta expression levels. (C) The top ‘Original’ row depicts the 2D projections of the HCR data at 18ss. The bottom ‘Imputed’ row depicts the corresponding expression of these genes in the target composite image. (D) NM index density distributions computed from the 8-gene composite maps at 18ss, 24 and 28ss. Negative values of the NM index indicate mesodermal bias, whereas positive values indicate neural bias. med: median; p.val: pvalue for the Shapiro-Wilk test; out: outlier percentage; H: empirical entropy estimate; var: variance. (E) Entropy estimates of the NMp index, with the estimation of the SE obtained via jackknife resampling. The entropy estimates consistently peak at 24ss. entropy_jeffrey: Dirichlet-multinomial pseudocount entropy estimator (Dirichlet) with Jeffrey’s prior; entropy_laplace: Dirichlet with Laplace’s prior; entropy_ML: empirical maximum likelihood estimator; entropy_MM: Miller-Madow estimator; entropy_shrink: James-Steintype shrinkage estimator. |
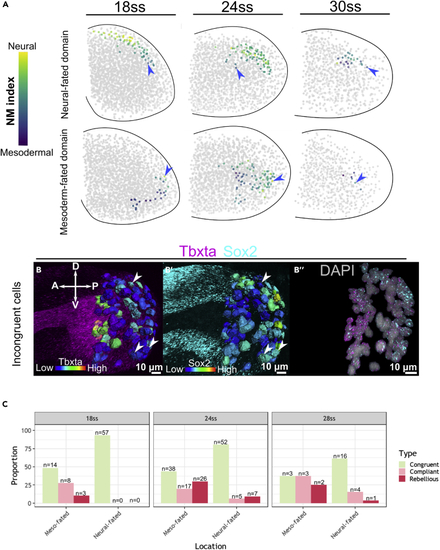
ZebReg’s composite maps reveal that the number of Rebellious cells peak at 24ss (A) Demarcation of the neural-fated and mesoderm-fated domains in the composite maps. Non-NMps are colored gray, whereas NMps are colored according to their NM index levels. Blue arrows mark incongruent cells. (B–B″) HCR stains of a representative zebrafish tailbud at 24ss for tbxta and sox2. Segmented surfaces correspond to NMps which are colored by the expression levels of tbxta (B) and sox2 (B′). Nuclear signals for sox2 and tbxta are shown to illustrate co-expression (B″). Arrow heads mark Incongruent cells. (C) Proportion of Congruent, Compliant and Rebellious cells in the mesoderm-fated and neural-fated domains at 18ss, 24 and 28ss. At each stage, summing up the number of Compliant and Rebellious cells yields the number of Incongruent cells. |