
- Title
-
Pinostrobin ameliorates lipopolysaccharide (LPS)-induced inflammation and endotoxemia by inhibiting LPS binding to the TLR4/MD2 complex
- Authors
- Athapaththu, A.M.G.K., Lee, K.T., Kavinda, M.H.D., Lee, S., Kang, S., Lee, M.H., Kang, C.H., Choi, Y.H., Kim, G.Y.
- Source
- Full text @ Biomed. Pharmacother.
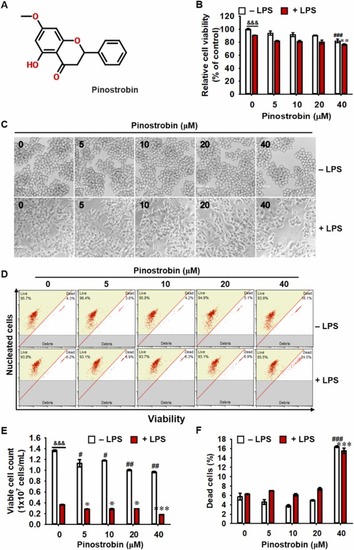
Pinostrobin at concentrations of less than 20 μM does not show cytotoxicity. (A) Chemical structure of pinostrobin. (B-F) RAW 264.7 macrophages were treated with 0–40 µM pinostrobin for 2 h, followed by stimulation with 300 ng/mL LPS for 24 h. (B) Cell viability was determined by MTT assay. (B) Morphological images were captured under phase-contrast microscopy. (C) Cell viability was measured using flow cytometry. (D) Viable cell count and (E) dead cell population were obtained from flow cytometric analysis. &&&, p < 0.001 vs. untreated cells (Student's t-test); #, p < 0.05, ##, p < 0.01, and ###, p < 0.001 vs. untreated cells (One-way ANOVA); *, p < 0.05, **, p < 0.01, and ***, p < 0.001 vs. LPS-treated cells (One-way ANOVA). |

Pinostrobin suppresses LPS-stimulated NO and PGE2 production along with iNOS and COX-2 expression. RAW 264.7 macrophages were pretreated with the indicated concentrations of pinostrobin (0–20 μM) for 2 h, followed by treatment with 300 ng/mL LPS for 24 h. Release of (A) NO and (B) PGE2 to the culture media was measured using Griess reagent assay and ELISA, respectively. (C) Total RNA was extracted 6 h after LPS treatment, and RT-PCR was performed. The expression of iNOS and COX-2 was normalized relative to GAPDH expression. (D) After 12 h-incubation with LPS, cell lysates were prepared for western blotting. β-Actin was used to normalize iNOS and COX-2 expression. The relative density was calculated using ImageJ software. ##, p < 0.01 and ###, p < 0.001 vs. untreated cells; *, p < 0.05 and ***, p < 0.001 vs. LPS-treated cells. |
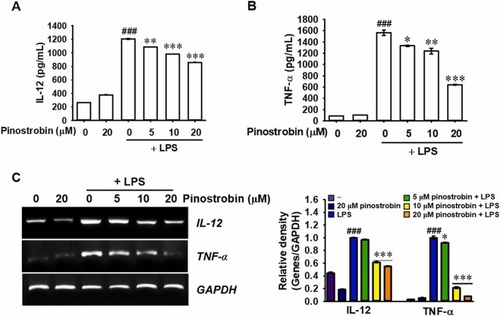
Pinostrobin downregulates LPS-stimulated IL-12 and TNF-α production by suppressing their gene expression. RAW 264.7 macrophages were pretreated with pinostrobin (0–20 μM) 2 h before incubation with 300 ng/mL LPS. After 24-h incubation with LPS, (A) IL-12 and (B) TNF-α release was measured in the culture supernatants using ELISA. (C) Total RNA was extracted 6 h after LPS treatment, and RT-PCR was performed. GAPDH was used for normalizing IL-12 and TNF-α expression. The relative density was calculated using ImageJ software. ###, p < 0.001 vs. untreated cells; *, p < 0.05, **, p < 0.001, and ***, p < 0.001 vs. LPS-treated cells. |
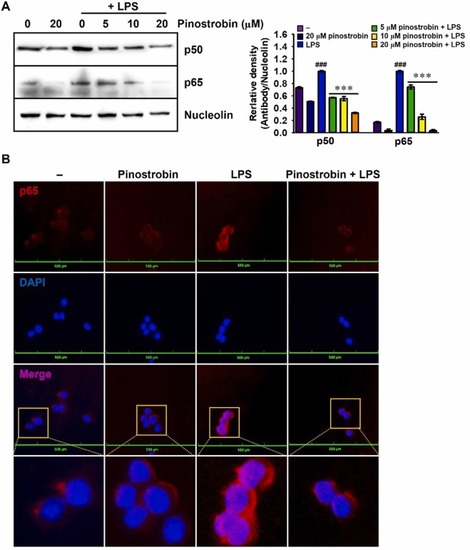
Pinostrobin downregulates nuclear accumulation of NF-κB. (A) RAW 264.7 macrophages were pretreated with pinostrobin (0–20 μM) 2 h before treatment with 300 ng/mL LPS for 30 min. Nuclear proteins were collected and used for western blotting. Nucleolin was used for normalizing p50 and p65 expression. The relative density was calculated using ImageJ software. (B) In a parallel experiment, p65 was immunostained with anti-p65 antibody (Ab) and detected using secondary Ab conjugated with Alexa Fluor 647 (red) followed by DAPI (blue) staining for nuclei (scale bar = 100 µm). The fluorescence was analyzed using a CELENA S Digital Imaging System. ###, p < 0.001 vs. untreated cells; ***, p < 0.001 vs. LPS-treated cells. |

Pinostrobin possibly binds to the TLR4/MD2 complex. (A) The ribbon model (pose 1, the strongest binding pose) represents that pinostrobin fits into the TLR4/MD2 complex (PDB; 3FXI, left). MD2 (red and chartreuse) and TLR4 (cyan and blue) are shown. Block dotted square shows the binding site and enlarged (right). (B) 2D interaction diagram from pose 1 was obtained using BIOVIA Discovery Studio Visualizer. Green line, carbon hydrogen bond; pink line, π-alkyl or alkyl interactions; light green circle, van der Waals interactions. (C) RAW 264.7 macrophages were pretreated with pinostrobin (0–20 μM) 2 h before incubation with 300 ng/mL LPS. Cellular protein was extracted 30 min after LPS treatment, and western blotting was performed. β-Actin was used for normalizing MyD88 and p-IRAK4 expression. The relative density was calculated using ImageJ software. ###, p < 0.001 vs. untreated cells; ***, p < 0.001 vs. LPS-treated cells. |

Pinostrobin recovers heart rate and attenuates mortality and abnormality in LPS-microinjected zebrafish larvae. Zebrafish larvae at 3 dpf (n = 20) were microinjected with 2 nL of 0.5 mg/mL LPS and immediately treated with the indicated concentrations of pinostrobin (0–20 μM). (A) After 24 h (at 4 dpf), heart rate was measured by manually counting heartbeats per minute to assess cardiotoxicity. ###, p < 0.001 vs. untreated zebrafish larvae; **, p < 0.01 and ***, p < 0.001 vs. LPS-microinjected zebrafish larvae. (B) Phenotype-based evaluations were performed 48 h (at 5 dpf) after LPS microinjection. LPS microinjection increases abnormalities in zebrafish larvae; normal, death, cyrtosis, yolk necrosis, yolk sac edema yolk crenulation, pericardial edema, and head malformation. (C) LPS microinjection induced 50% abnormalities in zebrafish larvae (left), and pinostrobin (20 μM)-treated zebrafish reduced the abnormality to 10% (right). |

Pinostrobin reduces LPS-induced macrophage and neutrophil recruitment in zebrafish larvae. Zebrafish larvae at 3 dpf (n = 20) were microinjected with 2 nL of 0.5 mg/mL LPS and immediately treated with pinostrobin (0–20 μM) for 24 h (at 4 dpf). (A) Neutral red staining of macrophages and (B) Sudan black staining for neutrophils were performed. (C) In a parallel experiment, total RNA was isolated, and RT-PCR was performed. The expression of iNOS, COX-2a, IL-12, and TNF-α was measured and normalized compared to that of β-actin expression. ###, p < 0.001 vs. PBS-microinjected zebrafish larvae; **, p < 0.01 and ***, p < 0.001 vs. LPS-microinjected zebrafish larvae. |