
- Title
-
Hyperactivation of mTORC1 in a double hit mutant zebrafish model of tuberous sclerosis complex causes increased seizure susceptibility and neurodevelopmental abnormalities
- Authors
- De Meulemeester, A.S., Heylen, L., Siekierska, A., Mills, J.D., Romagnolo, A., Van Der Wel, N.N., Aronica, E., de Witte, P.A.M.
- Source
- Full text @ Front Cell Dev Biol
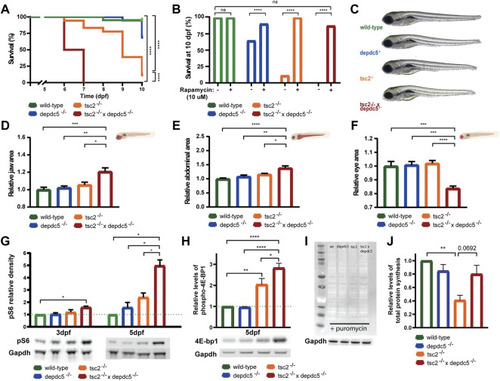
Survival analysis and morphological alterations in double homozygous larvae. (A) Kaplan-Meier curves of wild-type, depdc5 −/−, tsc2 −/−, and double homozygous larvae. Viability of larvae was assessed daily from 0 dpf until 10 dpf. Significant values (Log rank test) are noted as ****p < 0.0001. (B) Survival proportions at 10 dpf of wild-type, depdc5 −/−, tsc2 −/−, and double homozygous larvae with or without 10 μM rapamycin treatment. Significant values (one-way ANOVA) are noted as ****p < 0.0001. (C) Representative images of 5 dpf wild-type, depdc5 −/−, tsc2 −/−, and double homozygous larvae. (D)–(F) Quantification of jaw size (D), abdominal area (E) and eye size (F) in (C). Data are presented as mean ± SEM, n = 8–10 larvae/condition. Significant values (one-way ANOVA) are noted as ***p ≤ 0.001, **p ≤ 0.01 and *p ≤ 0.05. (G) Relative quantification of pS6 protein levels at 3 and 5 dpf in zebrafish heads of wild-type, depdc5 −/−, tsc2 −/−, and double homozygous larvae, normalized to Gapdh and represented as fold change expression versus wild-type. Representative blots for pS6 and Gapdh are shown below the graph. Data are presented as mean ± SEM, n = 3. Significant values (one-way ANOVA) are noted as ***p ≤ 0.001, **p ≤ 0.01 and *p ≤ 0.05. (H) Relative quantification of phospho-4E-bp1 protein levels at 5 dpf in zebrafish heads of wild-type, depdc5 −/− , tsc2 −/− , and double homozygous larvae, normalized to Gapdh and represented as fold change expression versus wild-type. Representative blots for phospho-4E-bp1 and Gapdh are shown below the graph. Data are presented as mean ± SEM, n = 4. Significant values (one-way ANOVA) are noted as ****p ≤ 0.0001, **p ≤ 0.01 and *p ≤ 0.05. (I) Representative blot of SUnSET assay following the incorporation of puromycin into newly synthesized proteins in wild-type, depdc5 −/−, tsc2 −/−, and double homozygous larvae at 5 dpf. Gapdh was used as loading control and a representative blots for Gapdh is shown below the anti-puromycin blot. (J) The average intensity of puromycin signal, normalized to Gapdh signal and represented as fold change expression versus wild-type. Data are represented as ± SEM, n = 3. Significant values (one-way ANOVA) are noted as **p ≤ 0.01. |
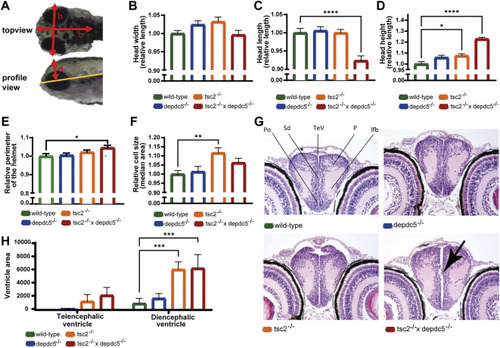
Analysis of the brain abnormalities by microscopy and histology. (A) Different head parameters measured in wild-type, depdc5–/–, tsc2–/–, and double homozygous larvae, with arrows indicating the head width (B), head length (C), head height (D) and head helmet (E). (B–E) Quantification of the head width (B), head length (C), head height (D) and helmet perimeter (E) of wild-type, depdc5 −/−, tsc2 −/−, and double homozygous larvae at 5 dpf. Absolute lengths were normalized against the wild-type group and relative lengths are reported. Data are presented as mean ± SEM, n = 8–11 larvae/condition. Significant values (one-way ANOVA) are noted as****p < 0.0001, *p < 0.05. (F) Quantification of the median cell size of EGFP-labelled GABAergic cells in the optic tectum. Data are presented as median ±SEM, n = 12–20 larvae/condition. Significant values (one-way ANOVA) are noted as **p < 0.001. (G) Representative 40x images of the anterior diencephalon in wild-type, depdc5 −/−, tsc2 −/− and double homozygous larvae at 5 dpf. n = 4 larvae/group. Black arrow indicates the protrusion of cells into the ventricle. (H) Quantification of the ventricle area in the pallial and posterior diencephalic area. Data are presented as mean ± SEM, n = 4 larvae/condition. Significant values (one-way ANOVA) are noted as ***p < 0.001. |

Locomotor behaviour and electrophysiology assessment of double homozygous zebrafish larvae. (A) Locomotor activity (average total movement, expressed in actinteg units) tracked during light (5 min) and dark (10 min) periods of wild-type, depdc5 −/−, tsc2 −/− , and double homozygous larvae at 5 dpf. Data are presented as mean ± SEM, n = 13–29 larvae/condition. Significant values (two-way ANOVA) are noted as ****p < 0.0001. (B,C) Power spectral density (PSD) ranging from 0 to 120 Hz normalized against the wild-type group. The PSD per 10 Hz (B) and per larvae (C) over the 20–100 Hz region are plotted as mean ± SEM, n = 6–23 larvae/condition. No significant values (one-way ANOVA) were detected, ns p > 0.05. (D) Locomotor activity tracked in the dark (30 min) in the presence of 5 mM PTZ of wild-type, depdc5 −/−, tsc2 −/− , and double homozygous larvae at 5 dpf. Data are presented as mean ± SEM, n = 8–16 larvae/condition. Significant values (two-way ANOVA) are noted as ****p < 0.0001, **p < 0.01. (E,F) Power spectral density (PSD) ranging from 0 to 120 Hz normalized against the wild-type group. All animals were treated with 5 mM PTZ. The PSD per 10 Hz region (E) and per larvae over the 30–90 Hz region (F) are plotted as mean ± SEM, n = 17–26 larvae)/condition. Significant values (one-way ANOVA) are noted as **p < 0.01 and *p < 0.05. (G) Representative 10-mins recordings (scale bar; 0.5 mV – 2 min) of wild-type, depdc5 −/−, tsc2 −/− , and double homozygous larvae at 5 dpf after 5 mM PTZ immersion for 15 min. |
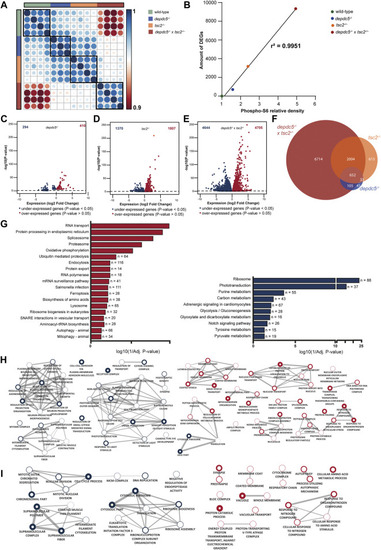
Comparison of the transcriptome profiles of depdc5, tsc2 and double homozygous zebrafish larvae. (A) Spearman’s rank correlation matrix of the RNA-Seq data showing separate clustering of wild-types, depdc5 −/−, tsc2 −/− , and double homozygous larval samples. Areas of the circles show absolute values of corresponding correlation coefficients. Different genotypes are indicated in distinct color codes. Scale bar indicates the strength of the correlation. (B) Linear and significant relationship between the levels of pS6 protein and the amount of DEGs. (C) Volcano plot showing the differentially expressed genes (DEG) (padj <0.05) between depdc5 −/−and wild-type larvae. (D) Volcano plot showing the DEGs (padj <0.05) between tsc2 −/− and wild-type larvae. (E) Volcano plot showing the DEGs (padj <0.05) between double homozygotes and wild-type larvae. (F) Overlap of differentially expressed genes between depdc5 −/−, tsc2 −/− , and double homozygous zebrafish larvae. For the depdc5 −/− and tsc2 −/− homozygotes 90% and 80% of the total DEGs, respectively, were found to overlap with that of the double homozygotes. The proportion overlapping DEGs with the double mutant were dependent on the genotype of the zebrafish (Chi-squared test, p-value = 3.648e-13). (G) Enriched KEGG pathways from differentially expressed genes between double homozygous zebrafish larvae and wild-types. Pathways enriched amongst upregulated genes are indicated in red, pathways enriched amongst downregulated genes are indicated in blue. The x-axis represents the log10 (1/p-value), n indicates the number of genes appearing in each pathway. (H) GO enrichment map from up and downregulated genes between double homozygous zebrafish larvae and wild-types and (I) tsc2 −/− zebrafish larvae and wild-types. Each node represents a different GO term, the red and blue outside of nodes indicate enrichment in up or downregulated genes, respectively. Green node indicating GO term enriched in both up and downregulated gene lists. The larger the node the greater the number of genes in the enriched GO term. Connecting lines indicate common genes shared between nodes, the thicker the line the more genes in common. |
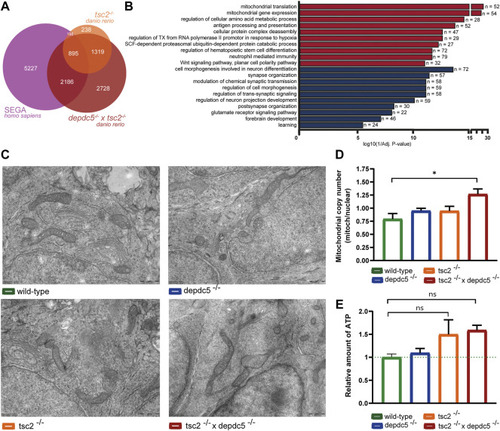
Comparison of the transcriptome of double homozygous zebrafish larvae and human SEGA samples. (A) Overlap of differentially expressed genes between tsc2 −/− zebrafish larvae, double homozygous zebrafish larvae (after conversion to human orthologs) and SEGA samples. 38% and 13% of total DEGs in the SEGA transcriptome were found to overlap with the double and tsc2 homozygotes transcriptome, respectively. A Chi-square test indicated that there was a statistically significant association (p = 2.2e-16) between the zebrafish genotype and the proportion of overlapping genes. (B) Enriched GO terms from up and downregulated genes that are shared between double homozygous zebrafish larvae and human SEGA samples. Terms enriched amongst upregulated genes are indicated in red, terms enriched amongst downregulated genes are indicated in blue. The x-axis represents the log10 (1/p-value), n indicates the number of genes appearing in each category. (C) Representative electron microscopy images (scale bar; 500 nm) visualizing mitochondria in wild-type, depdc5 −/−, tsc2 −/− , and double homozygous zebrafish larvae at 5 dpf. n = 1 larvae/group (D) Mitochondrial copy number in wild-type, depdc5 −/−, tsc2 −/− , and double homozygous zebrafish heads at 5 dpf. Data are presented as mean ± SEM, n = 3–6 larvae/condition. Significant values (one-way ANOVA) are noted as *p < 0.05. (E) ATP Levels in wild-type, depdc5 −/−, tsc2 −/− , and double homozygous zebrafish heads at 5 dpf. Data are presented as mean ± SEM, n = 15–20 larvae/condition. No statistical significant differences were detected (one-way ANOVA). |