
- Title
-
Loss of NECTIN1 triggers melanoma dissemination upon local IGF1 depletion
- Authors
- Ablain, J., Al Mahi, A., Rothschild, H., Prasad, M., Aires, S., Yang, S., Dokukin, M.E., Xu, S., Dang, M., Sokolov, I., Lian, C.G., Zon, L.I.
- Source
- Full text @ Nat. Genet.

a, List of the five most significant chromosomal deletions found in TCGA dataset of 363 human cutaneous melanomas. False discovery rate q-values were calculated by GISTIC. b, Linear copy number of the NECTIN1 locus in human melanoma (363 samples represented on the y axis). Blue denotes deletions, red, amplifications. The gray bar on the scale represents the focal deletion found by GISTIC analysis. c, Images of human melanoma sections stained for NECTIN1 by immunohistochemistry. Scale bar, 20 μm. d, Quantification of overall NECTIN1 staining intensity in 180 primary melanomas and 73 melanoma metastases (mean ± standard deviation (s.d.). Two-tailed t-test. e, Overall survival curves of patients with melanoma stratified according to NECTIN1 copy number status (> −0.25: no deletion, n = 190; < −0.25: deletion, n = 168 (log-rank test). |

a, Schematic representation of the generation of genetically engineered primary melanomas in adult zebrafish (Methods). b, Proportion of nectin1a and nectin1b mutant alleles in 65 primary zebrafish melanomas expressing a CRISPR vector targeting nectin1a and nectin1b. Bar represents median; paired two-tailed t-test. c, Box-and-whisker plot representing the number of nectin1a and nectin1b mutant alleles per primary zebrafish melanoma described in panel b (min-max, 1st and 4th quartiles, median, n = 65; paired two-tailed t-test). d, Type and proportion of nectin1a and nectin1b mutant alleles in 10 representative primary zebrafish melanomas. D, deletion, I, insertion; numbers denote affected base pairs. The last section in each bar represents all other minor alleles. e, Tumor-free survival curves of Tg(mitf:BRAFV600E);tp53−/− zebrafish injected with vectors targeting either nectin1 or a control gene (pooled data of three independent experiments; log-rank test). f, Representative images of sections of control- or nectin1-knockout (KO) primary zebrafish melanomas, stained for phospho-histone3 (p-H3) by immunohistochemistry (IHC). Scale bar, 20 μm. g, Quantification of overall p-H3 staining intensity in 8 nectin1-wildype and 10 nectin1-knockout primary zebrafish melanomas (mean ± s.d.; two-tailed t-test). NS, not significant. h, Pictures of organs presenting with disseminated tumor cells (arrowheads) in hematoxylin/eosin-stained sections of 16-week-old zebrafish bearing nectin1-knockout melanoma. Scale bar, 20 μm. i, Number of 16-week-old zebrafish with disseminated melanoma cells in the indicated organs. j, Quantification of organ involvement in 16-week-old zebrafish bearing control (n = 11) or nectin1-knockout (n = 10) melanoma (mean ± s.d.). Two-tailed t-test. k, Schematic representation of the melanoma spreading assay in adult zebrafish (top) and representative images of casper zebrafish 7 or 21 days after transplantation with control- or nectin1-knockout melanoma cells (bottom). Insets show ×2 magnification views. Arrows indicate patches of disseminated melanoma cells. Scale bar, 1 cm. l, Quantification of the proportion of secondary recipients of control- (n = 10) or nectin1-knockout (n = 9) tumors showing tumor spreading (mean ± s.d.; two-tailed t-test). m, Cell count of control- and nectin1-knockout primary zebrafish melanoma lines in the presence or absence of zebrafish (zf) culture media. Data are presented as mean ± s.d. of three independent experiments. |
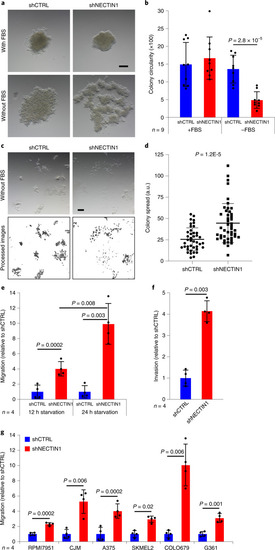
a, Images of the structures formed by 10,000 A375 human melanoma cells stably expressing a control shRNA (shCTRL) or an shRNA directed against NECTIN1 (shNECTIN1) after 8 days in low-attachment conditions in the presence or absence of serum (FBS). Scale bar, 200 μm. Data are representative of nine independent experiments. b, Circularity of the colonies formed by A375 human melanoma cells in low-attachment conditions as shown in panel a (Methods). Data are presented as mean ± s.d. of nine independent colonies per condition (paired two-tailed t-test). c, Images of the colonies formed by 1,000 of the cells described in panel a after 7 days in collagen-rich matrix in the absence of serum (FBS) (top). Scale bar, 50 μm. Data are representative of three independent experiments. Analysis of the images shown on top using ImageJ (bottom). d, Spread of the colonies formed by A375 human melanoma cells in collagen-rich matrix as shown in panel c (Methods). Data are presented as mean ± s.d. (n = 41 (shCTRL) and n = 45 (shNECTIN1)) of three independent experiments (two-tailed t-test). a.u., arbitrary units. e, Migration of A375 human melanoma cells stably expressing an shRNA directed against NECTIN1 (shNECTIN1) relative to cells expressing a control shRNA (shCTRL) in a transwell assay after 12 or 24 h of serum starvation. Data are presented as mean ± s.d. of four independent experiments. Cells were allowed to migrate for 6 h (paired two-tailed t-test). f, Invasion through Matrigel of A375 human melanoma cells after 12 h of serum starvation as described in panel e. Cells were allowed to migrate for 10 h. Data are presented as mean ± s.d. of four independent experiments (paired two-tailed t-test). g, Migration of six human melanoma cell lines after 12 h of serum starvation as described in panel e. Cells were allowed to migrate for different times depending on the cell line (Extended Data Fig. 4i and Methods). Data are presented as mean ± s.d. of four independent experiments (paired two-tailed t-test). |

a, Immunofluorescence analysis of α-catenin (green) and F-actin (red) in A375 human melanoma cells stably expressing a control shRNA (shCTRL) or an shRNA directed against NECTIN1 (shNECTIN1) cultured in the presence or absence of serum (FBS) for 12 h. Scale bar, 10 μm. Representative images of five independent experiments are shown. DAPI, 4,6-diamidino-2-phenylindole (blue), b, Quantification of adherens junction (AJ) formation as measured by α-catenin signal intensity on immunofluorescence images as shown in panel a. Data represent mean ± s.d. (n = 4 fields per condition; paired two-tailed t-test). c, Quantification of cell surface area based on immunofluorescence images as shown in panel a. Data represent mean ± s.d. (n = 21, 38, 18, 27 cells for shCTRL+FBS, shCTRL-FBS, shNECTIN1+FBS, and shNECTIN1-FBS, respectively; paired two-tailed t-test). d, Migration of three NECTIN1-knockout (KO) A375 human melanoma cell lines relative to three NECTIN1-wild-type (WT) A375 human melanoma cell lines in a transwell assay after 12 h of serum starvation. Cells were either allowed to settle for 12 h (pre-seeding) or not before being put in the presence of the chemotactic gradient. Cells were allowed to migrate for 6 h. Data represent mean ± s.d. of three independent experiments (paired two-tailed t-test). e, Proliferation of the cells described in panel a. Data represent mean ± s.d. of six independent experiments (paired two-tailed t-test). f, Representative images of colonies formed in Matrigel by the cells described in panel a after 14 days in culture. Scale bar, 1 mm. g, Number of colonies quantified from the experiments described in panel f. Data represent mean ± s.d. of six independent experiments (paired two-tailed t-test). |

a, Volcano plot representing the significance and relative abundance of cell-surface proteins in A375 human melanoma cells in the presence or absence of NECTIN1. A P value (two-tailed t-test) threshold of 0.05 was chosen (red: P < 0.05, black: P > 0.05). Some of the most differentially expressed proteins are indicated. b–e, Adhesion of A375 human melanoma cells stably expressing an shRNA directed against NECTIN1 (shNECTIN1) relative to cells expressing a control shRNA (shCTRL) to collagen-I-, fibronectin-, laminin- or vitronectin-coated surfaces at various timepoints after seeding. Data represent mean ± s.d. of four independent experiments (paired two-tailed t-test). f, Western blot analysis of ITGB levels in the cells described in panel b transfected with a control siRNA (C) or siRNAs targeting ITGB1 (1), ITGB2 (2), ITGB3 (3), ITGB4 (4) or ITGB5 (5). Data are representative of four independent experiments. g, Migration of the cells described in panel f relative to cells stably expressing a control shRNA (shCTRL) and transfected with a control siRNA in a transwell assay after 12 h of serum starvation. Cells were allowed to migrate for 6 h. Data represent mean ± s.d. of four independent experiments (paired two-tailed t-test; P values are shown for the comparisons siITGB versus siCTRL (shNECTIN1)). h, Migration of A375 human melanoma cells stably expressing an shRNA directed against NECTIN1 (shNECTIN1) relative to cells expressing a control shRNA (shCTRL) in a transwell assay upon treatment with an integrin α6β4 blocking antibody (ITG Ab, GoH3, 40 μg ml−1). Cells were allowed to migrate for 6 h. Data represent mean ± s.d. of four independent experiments (paired two-tailed t-test). IgG, immunoglobulin G. i, Migration of A375 human melanoma cells stably expressing an shRNA directed against NECTIN1 (shNECTIN1) relative to cells expressing a control shRNA (shCTRL) in a transwell assay upon treatment with two integrin αvβ3 and αvβ5 inhibitors (ITGi#1: SB273005; ITGi#2: echistatin). Cells were allowed to migrate for 6 h. Data represent mean ± s.d. of four independent experiments (paired two-tailed t-test). |

a, Migration of A375 human melanoma cells stably expressing an shRNA directed against NECTIN1 (shNECTIN1) relative to cells expressing a control shRNA (shCTRL) in a transwell assay upon treatment with a FAK inhibitor (FAKi, PF562271) or a SRC inhibitor (SRCi, dasatinib). Cells were allowed to migrate for 6 h. Data represent mean ± s.d. of three independent experiments. Paired two-tailed t-test. b, Migration of six human melanoma cell lines stably expressing an shRNA directed against NECTIN1 (shNECTIN1) relative to cells expressing a control shRNA (shCTRL) in a transwell assay upon treatment with two independent FAK inhibitors (FAKi#1, PF562271; FAKi#2, GSK2256098). Cells were allowed to migrate for different times depending on the cell line (Extended Data Fig. 4i and Methods). Data represent mean ± s.d. of four independent experiments (paired two-tailed t-test). c, Western blot analysis of FAK and SRC phosphorylation levels in the cells described in panel a in the absence of serum. C, shCTRL; Sh, shNECTIN1. Representative example of five independent experiments. Signal intensity was normalized to GAPDH and presented as a ratio to the vehicle-treated shCTRL condition. Data represent mean ± s.d. (paired two-tailed t-test). d, Representative images of sections of adult casper recipients transplanted with control- or nectin1-knockout primary zebrafish melanomas, stained for phospho-fak by immunohistochemistry. Scale bar, 50 μm. e, Quantification of phospho-fak (p-fak) staining intensity in casper recipients transplanted with nectin1-wild-type (n = 19) or nectin1-knockout (n = 28) zebrafish melanomas. Data represent mean ± s.d. (two-tailed t-test). f, Number of 16-week-old zebrafish with disseminated melanoma cells in the indicated organs. g, Quantification of organ involvement in 16-week-old zebrafish bearing nectin1/ctrl-knockout (n = 9) or nectin1/fak-knockout (n = 9) melanoma. Data represent mean ± s.d. (two-tailed t-test). h, Representative images of adult casper zebrafish transplanted with nectin1-knockout primary zebrafish melanoma cells expressing a control gRNA (ctrl-knockout) or a gRNA targeting fak (fak-knockout). Insets show ×2 magnification views. Arrowheads indicate patches of disseminated melanoma cells. Scale bar, 1 cm. i, Quantification of the proportion of secondary recipients of nectin1/ctrl-knockout (ctrl-KO, n = 7) or nectin1/fak-knockout (fak-KO, n = 6) tumors showing tumor spreading. Data represent mean ± s.d. (two-tailed t-test). |
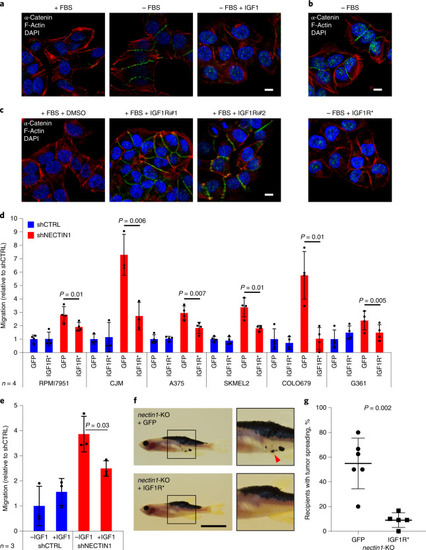
a, Immunofluorescence analysis of α-catenin (green) and F-actin (red) in A375 human melanoma cells in the presence or absence of serum (FBS) (blue, DAPI), complemented or not with 100 ng ml−1 IGF1 for 12 h. Scale bar, 10 μm. Data are representative of four independent experiments. b, Immunofluorescence analysis of α-catenin (green) and F-actin (red) in A375 human melanoma cells expressing or not a constitutively active form of the IGF1 receptor (CD8-IGF1R, IGF1R*), and cultured in the absence of serum (FBS) for 12 h (blue, DAPI). Scale bar, 10 μm. Data are representative of three independent experiments. c, Immunofluorescence analysis of α-catenin (green) and F-actin (red) in A375 human melanoma cells cultured in the presence of serum (FBS) and treated with DMSO (vehicle) or with two different IGF1R inhibitors (IGF1Ri#1: Linsitinib, 1 μM; IGF1Ri#2: GSK1838705A, 1 μM) for 12 h (blue, DAPI). Scale bar, 10 μm. Data are representative of four independent experiments. d, Migration of six human melanoma cell lines conditionally expressing GFP or a constitutively active form of IGF1R (CD8-IGF1R, IGF1R*), and stably expressing an shRNA directed against NECTIN1 (shNECTIN1) relative to cells expressing a control shRNA (shCTRL) in a transwell assay. Cells were allowed to migrate for different times depending on the cell line (Extended Data Fig. 4i and Methods). Data represent mean ± s.d. of four independent experiments (paired two-tailed t-test). e, Migration of A375 human melanoma cells stably expressing either a control shRNA (shCTRL) or an shRNA directed against NECTIN1 (shNECTIN1) in a transwell assay after 12 h of serum starvation in the presence or absence of 100 ng ml−1 IGF1. Cells were allowed to migrate for 6 h. Data represent mean ± s.d. of three independent experiments (paired two-tailed t-test). f, Representative images of adult casper zebrafish transplanted with nectin1-knockout primary zebrafish melanoma cells expressing GFP or a constitutively active form of IGF1R (CD8-IGF1R, IGF1R*), 21 days after injection. Insets show ×2 magnification views. Arrowhead indicates patches of disseminated melanoma cells. Scale bar, 1 cm. g, Quantification of the proportion of secondary recipients of nectin1-knockout tumors expressing GFP (n = 6) or nectin1-knockout tumors expressing CD8-IGF1R (IGF1R*) (n = 5) showing tumor spreading. Data represent mean ± s.d. (two-tailed t-test). |

a, Immunofluorescence analysis of α-catenin (green) and phospho-IGF1R (red) on a tissue section of human melanoma (blue, DAPI). Scale bar, 10 μm. Dotted line demarcates areas of high and low IGF1 signaling. Arrows point to adherens junctions. A representative example of nine independent tumors is shown. b, Diagram representing signal intensities of α-catenin (green) and phospho-IGF1R (red) in the section shown in panel a (Pearson’s correlation). c, Immunofluorescence analysis of E-cadherin (green) and NECTIN1 (red) (blue, DAPI) on a tissue section of the same tumor as in panel a. Scale bar, 10 μm. BV, blood vessel. d, Table showing the distribution of 20 tissue sections of human melanoma depending on the presence or absence of adherens junctions (as assessed by α-catenin staining) and NECTIN1 by immunofluorescence. Correlation was measured by chi-squared test. Note that the only NECTIN1-negative tumor exhibiting adherens junctions was positive for E-cadherin. e–g, Model for the role of NECTIN1 in melanoma. e, In the presence of IGF1, melanoma cells actively repress the formation of adherens junctions and proliferate, independent of NECTIN1 status. f, In the absence of IGF1, NECTIN1-wild-type melanoma cells form robust adherens junctions (red) and rely on cell–cell adhesion to stay in the niche. g, In the absence of IGF1, NECTIN1-deficient melanoma cells (that are unable to establish adherens junctions) switch to cell–matrix adhesion and activate an integrin/FAK/SRC axis, leading to their migration and dissemination. |