
- Title
-
Elevated photic response is followed by a rapid decay and depressed state in ictogenic networks
- Authors
- Myren-Svelstad, S., Jamali, A., Ophus, S.S., D'gama, P.P., Ostenrath, A.M., Mutlu, A.K., Hoffshagen, H.H., Hotz, A.L., Neuhauss, S.C.F., Jurisch-Yaksi, N., Yaksi, E.
- Source
- Full text @ Epilepsia

Spontaneous locomotor and neural activity display a hypoactive or hyperactive model‐dependent phenotype. (A) Locomotor behavior was recorded in a 24‐well plate. Mean swim velocity was calculated per 1‐s time bin during 1‐h baseline recordings in the pentylenetetrazole (PTZ), gabra1, and eaat2a models. (B) Neural activity fluctuation was calculated as the SD of relative change in fluorescence (ΔF/F; %) during the last 2 min of 1‐h recordings in 5‐day‐old Tg(elavl3:GCaMP6s) zebrafish larvae. Total sample size for behavioral experiments for PTZ model: control, n = 48; 1 mmol·L−1, n = 48; 5 mmol·L−1, n = 48; 15 mmol·L−1, n = 48; for gabra1 model: wild‐type (wt), n = 39; heterozygous (het), n = 81; homozygous (hom), n = 48; for eaat2a model: wt, n = 11; het, n = 41; hom, n = 42. Total sample size for calcium recordings for PTZ model: control, n = 8; 1 mmol·L−1, n = 7; 5 mmol·L−1, n = 9; 15 mmol·L−1, n = 10; for gabra1 model: wt, n = 9; het, n = 13; hom, n = 9; for eaat2a model: wt, n = 7; het, n = 13; hom, n = 11. *p < .05, **p < .01 by Wilcoxon rank‐sum test. Boxplots represent median with interquartile ranges; whiskers extend to the most extreme data points that are not outliers |
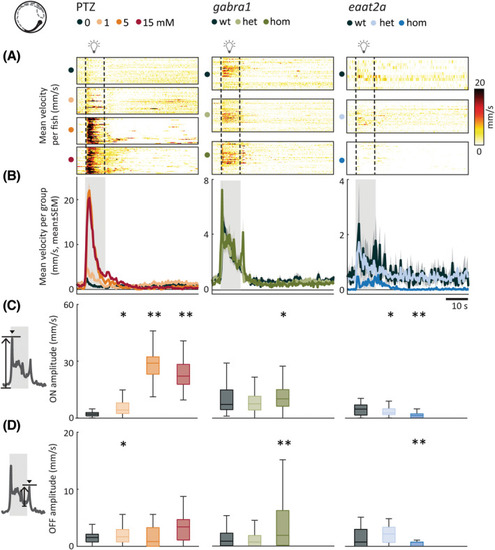
Photic stimulation leads to model‐dependent change in swim velocity. (A) Mean swim velocity in response to 10‐s photic stimulation with 5‐min interstimulus interval. Each line in heatmaps represents the average across five trials for one fish. Dashed lines indicate the start and end of photic stimulation. (B) Mean swim velocity per subgroup. Gray shaded area indicates photic stimulation. (C) Light‐on amplitude measured as maximum change in velocity during the first 5 s after light onset. (D) Light‐off amplitude measured as the maximum change in velocity during the first 5 s after light offset. Total sample size for pentylenetetrazole (PTZ) model: control, n = 42; 1 mmol·L−1, n = 42; 5 mmol·L−1, n = 41; 15 mmol·L−1, n = 41; for gabra1 model: wild‐type (wt), n = 39; heterozygous (het), n = 81; homozygous (hom), n = 48; for eaat2a model: wt, n = 11; het, n = 41; hom, n = 42. *p < .05, **p < .01 by Wilcoxon rank‐sum test. Shaded regions associated with individual colors represent SEM of each group. Boxplots represent median with interquartile ranges; whiskers extend to the most extreme data points that are not outliers |

Photic stimulation leads to model‐dependent change in swim angle. (A) Mean change in swim angle in response to 10‐s photic stimulation with 5‐min interstimulus interval. Each line in heatmaps represents the average across five trials for one fish. Dashed lines indicate the start and end of 10‐s photic stimulation. (B) Mean change in swim angle per subgroup. Gray shaded area indicates photic stimulation. (C) Light‐on amplitude measured as maximum change in swim angle during first 5 s after light onset. (D) Light‐off amplitude measured as the maximum change in swim angle during the first 5 s after light offset. Total sample size for pentylenetetrazole (PTZ) model: control, n = 42; 1 mmol·L−1, n = 42; 5 mmol·L−1, n = 41; 15 mmol·L−1, n = 41; for gabra1 model: wild‐type (wt), n = 39; heterozygous (het), n = 81; homozygous (hom), n = 48; for eaat2a model: wt, n = 11; het, n = 41; hom, n = 42. **p < .01 by Wilcoxon rank‐sum test. Shaded regions associated with individual colors represent SEM of each group. Boxplots represent median with interquartile ranges; whiskers extend to the most extreme data points that are not outliers |
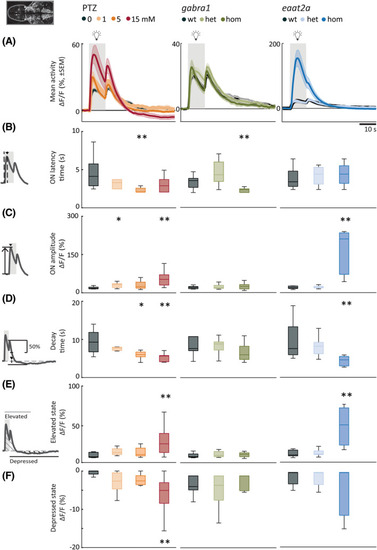
Photic stimulation elicits elevated neural responses with fast dynamics and prominent depressed state. (A) Mean neural calcium response (relative change in fluorescence [ΔF/F; %]) to photic stimulation per subgroup averaged across five trials of 5‐min interstimulus interval. Gray shaded area indicates photic stimulation. (B) Latency to peak amplitude during 10‐s photic stimulation. (C) Peak amplitude during photic stimulation. (D) Time constant for 50% decay of calcium signal from light offset. (E) Elevated state as measured by mean area under the curve above 2 SD from a 1‐min baseline (1 min period after light onset). (F) Depressed state as measured by mean area over the curve below 2 SD from a 1‐min baseline (first 2 min after light turned off). Total sample size for pentylenetetrazole (PTZ) model: control, n = 8; 1 mmol·L−1, n = 7; 5 mmol·L−1, n = 9; 15 mmol·L−1, n = 10; for gabra1 model: wild‐type (wt), n = 9; heterozygous (het), n = 13; homozygous (hom), n = 9; for eaat2a model: wt, n = 7; het, n = 13; hom, n = 11. For eaat2a hom mutants, four of 11 animals had only plateaulike events; hence, seven animals were included in the analyses for this figure. *p < .05, **p < .01 by Wilcoxon rank‐sum test. Shaded regions of individual colors represent SEM of each group. Boxplots represent median with interquartile ranges; whiskers extend to the most extreme data points that are not outliers |

Brain regions are differentially recruited upon photic stimulation. (A, F, K) Representative examples of fish during periods when light was turned on and off. Images show mean calcium signals (relative change in fluorescence [ΔF/F; %]) averaged across five trials. Upper panels show a time period starting 5 s after light onset, lower panels from 30 s after light offset. Both show the average activity during a 1.68‐s period. (B, G, L) Average calcium signals were extracted from five brain regions: telencephalon (TL), thalamus (TH), optic tectum (OT), cerebellum (CB), and brainstem (BS). Each line in heatmaps represents ∆F/F of one fish averaged across five trials of 5‐min interstimulus interval. (C, H, M) Average activity per subgroup, ∆F/F. (D, I, N) Cumulative distribution of latency to half maxima during photic stimulation. (E, J, O) Latency to half maxima for 15 mmol·L−1 pentylenetetrazole (PTZ; E), homozygous (hom) gabra1 mutants (J), and hom eaat2 mutants (O). Latency for optic tectum is compared with the four other brain regions. Total sample size for PTZ model: control, n = 8; 1 mmol·L−1, n = 7; 5 mmol·L−1, n = 9; 15 mmol·L−1, n = 10; for gabra1 model: wild‐type (wt), n = 9; heterozygous (het), n = 13; hom, n = 9; for eaat2a model: wt, n = 7; het, n = 13; hom, n = 11. For eaat2a hom mutants, four of 11 animals had only plateaulike events; hence, seven animals were included in the analyses for this figure. Shaded regions of individual colors represent SEM of each group. *p < .05, **p < .01 by Wilcoxon rank‐sum test. Boxplots represent median with interquartile ranges; whiskers extend to the most extreme data points that are not outliers |
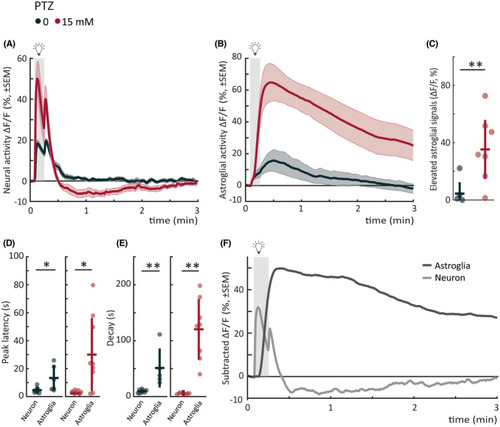
Astroglial photic response in seizure‐prone networks is slow, elevated, and mirrors neural depressed state. (A) Mean neural calcium response (relative change in fluorescence [ΔF/F; %]) to photic stimulation per subgroup averaged across five trials of 5‐min interstimulus interval. Gray shaded area indicates photic stimulation. The same dataset as in Figure 4A pentylenetetrazole (PTZ) trials is replotted for comparison with astroglial signals. (B) Mean astroglial calcium response (∆F/F) to photic stimulation per subgroup averaged across five trials of 5‐min interstimulus interval. Gray shaded area indicates photic stimulation. (C) Elevated astroglial signals as measured by mean area under the curve from a 5‐s baseline (5‐min period after light onset). (D) Latency to peak amplitude of response during 10‐s photic stimulation. Left panel shows neural versus astroglial responses for control; right panel shows the responses for 15 mmol·L−1 PTZ. (E) Time constant for 50% decay of calcium signal from light offset. Left panel shows neural versus astroglial responses for control; right panel shows the responses for 15 mmol·L−1 PTZ. (F) Mean calcium response (∆F/F) of control fish subtracted from mean response of 15 mmol·L−1 fish for astroglia (dark gray) versus neuron (light gray). Pearson correlation coefficient between average astroglial and neural signal is −.5403, calculated from time point of neural light‐on response peak until next light stimulus. Gray shaded area indicates photic stimulation. Total sample size for Tg(GFAP:Gal4);Tg(UAS:GCaMP6s) "astroglial" recordings: control, n = 7; 15 mmol·L−1, n = 9; for Tg(elavl3:GCaMP6s) "neural" recordings: control, n = 8; 15 mmol·L−1, n = 10. *p < .05, **p < .01 by Wilcoxon rank‐sum test. Each data point in scatter plots represents an individual fish. Error bars represent mean ± SD per subgroup. Shaded regions of individual colors represent SEM of each group. |