
- Title
-
Prevention of Oxidative Damage in Spinal Cord Ischemia Upon Aortic Surgery: First-In-Human Results of Shock Wave Therapy Prove Safety and Feasibility
- Authors
- Graber, M., Nägele, F., Röhrs, B.T., Hirsch, J., Pölzl, L., Moriggl, B., Mayr, A., Troger, F., Kirchmair, E., Wagner, J.F., Nowosielski, M., Mayer, L., Voelkl, J., Tancevski, I., Meyer, D., Grimm, M., Knoflach, M., Holfeld, J., Gollmann-Tepeköylü, C.
- Source
- Full text @ J. Am. Heart Assoc.
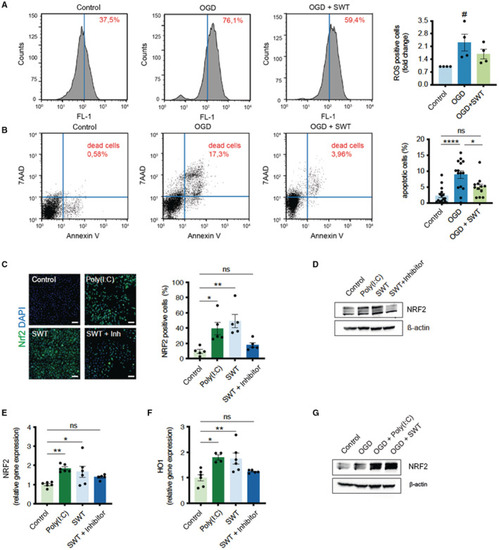
Shock wave therapy (SWT) reduces oxidative damage and neuronal apoptosis via NRF2.
A, SH‐SY5Y cells underwent oxygen/glucose deprivation for 4 hours. After 24 hours of reoxygenation, the amount of reactive oxygen species was detected by H2DCFDA via FACS analysis. Shock wave–treated cells showed reduced oxidative stress. Data are means±SEM. # P<0.05. n=4. B, FACS analysis of Annexin V/PI staining to determine apoptotic and necrotic cell death upon oxygen/glucose deprivation. Shock wave–treated cells showed greater survival in this setting. Data are means±SEM. *P<0.05; ****P<0.0001. n=16 (Control), n=15 (OGD), n=12 (OGD + SWT). C, Immunofluorescence staining revealed an increased number of NRF2 positive SH‐SY5Y cells after treatment with shock waves or Toll‐like receptor 3 agonist Poly(I:C). Addition of a Toll‐like receptor 3 inhibitor abolished shock wave‐mediated NRF2 expression. Scale bar: 100 μm. Data are means±SEM. *P<0.05; **P<0.01. n=5. D, Immunoblot analysis of NRF2 protein expression upon treatment with shock waves and Poly(I:C). Inhibition of TLR3 prevented NRF2‐expression upon SWT. E and F, Quantitative polymerase chain reaction analysis revealed increased gene expression levels of NRF2 and its downstream target HO‐1 (heme oxygenase‐1) upon SWT and treatment with TLR3 agonist Poly(I:C). Data are means±SEM. *P<0.05; **P<0.01. n=6. G, SH‐SY5Y cells undergoing oxygen/glucose deprivation showed increased protein expression of antioxidative NRF2 when pretreated with shock waves or Poly(I:C). Statistical comparison by ranks: Kruskal–Wallis test (A). Statistical comparisons between multiple groups: 1‐way ANOVA with Tukey post hoc analysis (B, C, E, F). OGD indicates oxygen/glucose deprivation; and SWT, shock wave therapy. |
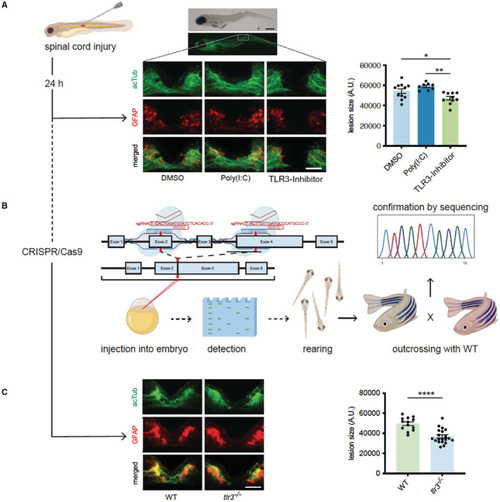
Zebrafish regenerate spinal cord injury via Toll‐like receptor 3 (TLR3).
A, Zebrafish larvae (4dpf) underwent traumatic spinal cord injury. After 24 hours, regeneration of spinal cord was assessed via immunofluorescence staining of acetylated Tubulin and glial fibrillary acidic protein. Inhibition of tlr3 prevents neuronal regeneration in zebrafish upon spinal cord injury. Scale bar: 500 μm (top); 50 μm (bottom). Data are means±SEM. *P<0.05; **P<0.01. n=11 (DMSO), n=8 (Poly(I:C)), n=10 (TLR3‐Inhibitor). B, TLR3‐deficient zebrafish were generated as illustrated using CRISPR/Cas9. C, Zebrafish lacking tlr3 failed neuronal regeneration upon spinal cord injury. Data are means±SEM. ****P<0.0001 n=13 (wild‐type), n=20(tlr3 −/−). Statistical comparisons between multiple groups: 1‐way ANOVA with Tukey post hoc analysis (A). Statistical comparisons between 2 groups: Student t‐test (B). acTUB, acetylated Tubulin; DMSO, dimethyl sulfoxide; GFAP, glial fibrillary acidic protein; TLR3, Toll‐like receptor 3; and WT, wild‐type. PHENOTYPE:
|
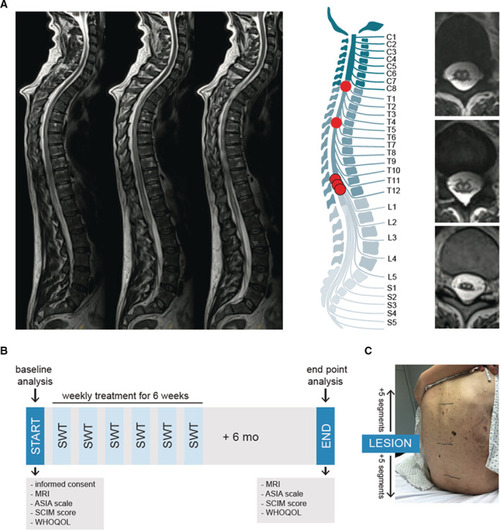
First‐in‐human application: shock wave therapy in patients with spinal cord ischemia.
A, Magnetic resonance imaging was used to confirm diagnosis of ischemic spinal cord injury. On the left, sagittal T2‐weighted turbo‐spin echo sequences show a long‐range cord hyperintensity involving the midaspect of the thoracic cord reaching from thoracic vertebra 3 to the expanded conus medullaris. The illustration shows the level of injury of each patient. Abnormal T2 hyperintense spots within the central gray matter (“owl's eye” pattern) are shown on the right side. n=5. B, The illustration shows the applied study protocol. Upon consent of participation, neurological level of injury was assessed via magnetic resonance imaging and physical examination by a neurologist using the Classification of the American Spinal Cord Injury Association scale. Subjective condition of the patients was assessed via the Spinal Cord Independence Measure and the World Health Organization Quality of Life questionnaire. Patients were treated once a week for 6 weeks and end point analysis was done 6 months upon the last treatment. C, Shock wave therapy included 5 segments above and below the defined level of injury. ASIA indicates American Spinal Injury Association; MRI, magnetic resonance imaging; SCIM, Spinal Cord Independence Measure; SWT, shock wave therapy; and WHOQOL, World Health Organization Quality of Life. |
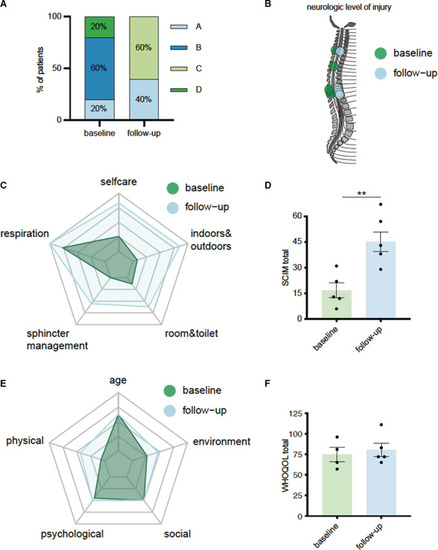
Shock wave therapy is safe and feasible in patients with spinal cord ischemia.
A, Classification of neurological impairment according to the American Spinal Injury Association at baseline and 6 months after therapy. B, Neurological levels of injury at baseline and 6 months after therapy. C, Radar chart comparing baseline levels to follow‐up levels in each category of the Spinal Cord Independence Measure. D, Total scores of Spinal Cord Independence Measure at baseline and 6 months after therapy. Data are means±SEM. **P<0.01. E, Radar chart showing the measurements of each category of the World Health Organization Quality of Life questionnaire. F, Total scores of the World Health Organization Quality of Life questionnaire at baseline and 6 months after therapy. Data are means±SEM. Statistical comparisons between 2 groups: Student t‐test (D). ASIA indicates American Spinal Injury Association; SCIM, Spinal Cord Independence Measure; and WHOQOL, World Health Organization Quality of Life. |