FIGURE SUMMARY
Title

Brain dysfunction during warming is linked to oxygen limitation in larval zebrafish

Authors
Andreassen, A.H., Hall, P., Khatibzadeh, P., Jutfelt, F., Kermen, F.
Source
Full text @ Proc. Natl. Acad. Sci. USA

The upper thermal limit in freely swimming zebrafish larvae and adults. (A and B) Schematic figure (A) and photo with top view (B) of the experimental setup for CTmax measurement in freely swimming zebrafish larvae. (B) Larva initial position is indicated by a yellow, filled arrowhead and the trajectory is represented in yellow during the following 30 s. The dashed black circle indicates the walls of the central chamber. The white arrowhead indicates the position of a thermocouple. The white asterisk indicates the tube for bubbling. (C) CTmax (temperature at loss of response for 5 and 9 d postfertilization [dpf] and loss of equilibrium for adults; see Methods) in 5-d-old (n = 12; black circles), 9-d-old (n = 12; dark gray circles), and adult fish (n = 15; light gray circles) (SI Appendix, Table S3). The bars and error bars indicate the group mean ± SE.

Embedded zebrafish larvae develop brain-wide depolarizations near the upper thermal limit. (A and B) Schematic overview (A) and image (B) of the experimental setup for whole-brain neural activity measurement in agar-embedded, 5-d-old Tg(elavl3:GCaMP6s) zebrafish larva. (B) Raw fluorescence image of the larva brain highlighting the telencephalon (dashed green lines) and medulla (dashed magenta lines). A, anterior; L, lateral. (C and D) Change in fluorescence (% ΔF/F0; left y-axis) in the telencephalon and medulla of a representative control larva (C) and a representative heat-ramp larva (D). The water temperature (gray) was maintained at 28 °C throughout the recording (right y-axis in C) for the control fish and was increased during a heat-ramp treatment (0.3 °C/min) until a brain-wide depolarization was detected and then rapidly adjusted to 28 °C until the end of the recording (right y-axis in D). Note the return to holding temperature in heat-ramp fish and recovery of normal brain activity and calcium peaks 10 to 15 min after the brain-wide depolarization in D. (E) Heat map illustrating the temporal spread of the depolarization throughout the brain in a representative heat-ramp fish mounted laterally (Methods). D, dorsal. (F) Frequency of medulla calcium peaks in heat-ramp fish (n = 11; magenta line) during the 50 min preceding the brain-wide depolarization and during the corresponding period in control fish (n = 8; magenta dashed line) (SI Appendix, Table S4). The depolarization onset in heat-ramp fish is indicated by a dashed vertical line. (G) Temperature at depolarization onset in heat-ramp fish (n = 11). (F and G) Data are presented with mean (solid line) and SE (shaded area) in (F) and with a bar and error bars in (G).

CTmax precedes the brain-wide depolarization in freely swimming zebrafish larvae. (A) Schematic overview of the experimental setup for calcium imaging in freely swimming, 5-d-old Tg(elavl3:GCaMP6s) zebrafish larvae. (B) Top view of setup with color-coded time projection of a heat-ramp fish’s movements in the setup for 3 min (34 to 35 °C). (C) Representative images of brain fluorescence in the same fish as in B, before (Left) and during (Right) the brain-wide depolarization. (D) CTmax and depolarization-onset temperatures measured in heat-ramp fish (black circles; n = 7) (SI Appendix, Table S5). The bars and error bars indicate the mean and SE.

Heart rate before and during the brain-wide depolarization in embedded zebrafish larvae. (A, Top) Representative example of simultaneous neural-activity and heart-rate imaging in a 5-d-old Tg(elavl3:GCaMP6s) zebrafish larva embedded laterally in agar, using epifluorescence microscopy. The brain is outlined with black dashed lines and the heart with a dashed gray square. (Bottom) The heart region (dashed yellow line) is shown in inverted greyscale (A, anterior; D, dorsal) during a cardiac cycle. (B; Top) Change in brain fluorescence (%ΔF/F0) in the same fish as in A, at 31 °C. Changes in brain fluorescence are indicated by gray arrows. (Bottom) Change in luminosity within a region of interest in the heart during the same period, which is used to calculate the heart rate. (C) Average heart rate in embedded heat-ramp fish (n = 9). The x-axis shows ranges of 1 °C elevation during which the heart rate was measured. The fifth temperature category (brain depolarization) corresponds to heart rate during the 60 s before and the 30 s after peak brain depolarization. The sixth category corresponds to heart rate after fish were rapidly returned to holding temperature. Horizontal bars and error bars indicate the mean and SE. The colored lines represent individual fish (SI Appendix, Table S6). (D and E) Change in neural activity (D) and heart rate (E) during the brain-wide depolarization (same period as brain depolarization in C). Gray lines represent individual fish and the thick black line represents the mean. All traces are aligned with respect to the peak fluorescence (vertical dashed line).

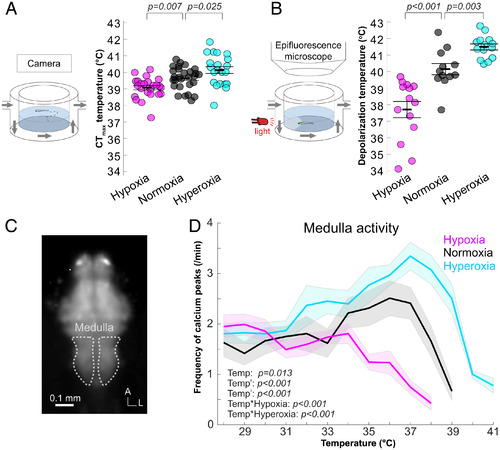
Oxygen availability affects both CTmax and onsets of neural dysfunctions. (A) Effect of oxygen availability on CTmax measured in freely swimming fish (setup illustrated in Left panel) during heat ramping with water oxygen level of 60% (hypoxia; magenta circles; n = 24), 100% (normoxia; black circles; n = 28), or 150% (hyperoxia; cyan circles; n = 21) of air-saturated water (SI Appendix, Table S7). (B) Brain-wide depolarization-onset temperatures measured in agar-embedded, Tg(elavl3:GCaMP6s) 5-d-old fish (setup illustrated in Left panel) during heat ramping in hypoxia (n = 14), normoxia (n = 12), and hyperoxia (n = 14) (SI Appendix, Table S8). It is important to bear in mind that CTmax (A) and neural (B) data were collected in freely swimming versus embedded larvae, respectively, and that direct comparisons of these temperatures should be interpreted with caution. (C) Image outlining the medulla where the frequency of calcium peaks was measured. A, anterior; L, lateral. (D) Frequency of medulla calcium peaks during heat ramping in hypoxia (n = 12), normoxia (n = 10), and hyperoxia (n = 11) (SI Appendix, Table S9). (A, B, D). Results for hypoxia (60%; magenta), normoxia (100%; black), and hyperoxia (150%; cyan) are presented with mean and SE (A and B: bars and error bars; D: solid lines and shaded area). Temp, temperature.

Oxygen availability affects the sensory-response resilience to heating. (A) Mean fluorescence image of the brain (dashed gray line) of an agar-embedded, Tg(elavl3:GCaMP6s) 5-d-old fish under an epifluorescence microscope (same setup as in Fig. 5B). A, anterior; L, lateral. (B) Representative light response to a red-light flash specifically activating the optic tecti in the same fish as in A. (C) Percentage of responses to light flashes in the optic tectum during heat ramping with water oxygen level of 60% (hypoxia; magenta circles; n = 14), 100% (normoxia; black circles; n = 11), or 150% (hyperoxia; cyan circles; n = 13) of air-saturated water (Methods) (SI Appendix, Table S10). Temp, temperature.

Acknowledgments
This image is the copyrighted work of the attributed author or publisher, and ZFIN has permission only to display this image to its users. Additional permissions should be obtained from the applicable author or publisher of the image. Full text @ Proc. Natl. Acad. Sci. USA