
- Title
-
Zinc transporter Slc30a1 regulates melanocyte development by interacting with mt2 in zebrafish
- Authors
- Xia, Z., Yang, X., Bi, X., Tong, X., Min, J., Wang, F.
- Source
- Full text @ Eur. J. Cell Biol.

The pigment phenotype compared among wild-type embryos (wt), slc30a1 sibling controls (control) and slc30a1 double mutants (mutant). A-B, The embryonic phenotypes under a stereomicroscope with PTU treatment at different concentrations (1 ×, 4925 nmol; 1.5 ×, 7388 nmol; 2 ×, 9850 nmol) from 24 to 36 hpf (A) or 24–48 hpf (B). Note the remaining pigments in the eyes (yellow arrows) and back skin (red arrows) in mutant embryos.C-D, Quantitative analysis based on grayscale measurement of the pigments in eyes with PTU treatments from 24 to 36 hpf (C) or from 24 to 48 hpf (D). E, Quantitative analysis based on the pigment size in the embryonic back skin with 1 × PTU treatment from 24–48 hpf. *p < 0.05, **p < 0.01, ***p < 0.001 and n.s., not significant. (For interpretation of the references to colour in this figure legend, the reader is referred to the web version of this article.) |

The expression of melanocyte markers detected in sibling controls and mutant embryos. A-D, The relative expression levels of melanocyte marker genes in control and mutant embryos detected by qPCR. E-H, The expression pattern of melanocyte marker genes in control and mutant embryos detected by in situ hybridization. Note the disorganized expression of mitfa (yellow arrows) and increased expression of dct (red arrows) in the mutants. I, The relative staining area normalized to the embryonic size detected by the dct probe in the skin of control and mutant embryos. J, Quantitative analysis based on grayscale measurement of the pigments in eyes detected by the dct probe. *p < 0.05, ***p < 0.001 and n.s., not significant. (For interpretation of the references to colour in this figure legend, the reader is referred to the web version of this article.) |

Elevated mt2 expression in melanocytes of slc30a1 mutants. A, The 30 significantly changed KEGG pathways revealed by SMART-seq data. Pathways related to cancer development are highlighted by red rectangles. B-C, The GO terms related to pigment or melanocyte development (B) or zinc biology (C) revealed by SMART-seq data. D, Heatmap analysis of genes containing the significantly changed GO terms “melanosome organization” and “response to zinc ion”. E, The expression level of mt2 in control and mutant embryos detected by qPCR. F, Whole-mount in situ hybridization of mt2 in control and mutant embryos at different stages. The ysl and pigments in the head are indicated by red arrows. **p < 0.01 and ***p < 0.001. (For interpretation of the references to colour in this figure legend, the reader is referred to the web version of this article.) |
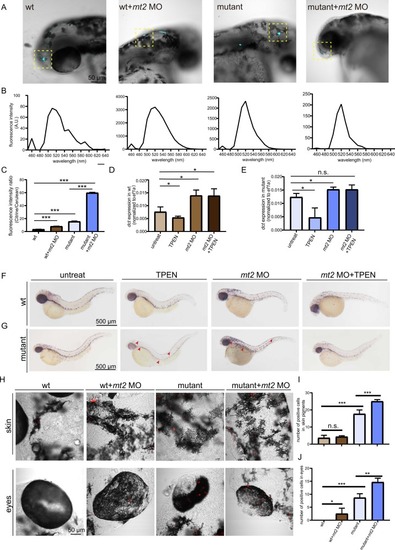
Free zinc detection, pigment formation and proliferation analysis in embryos with different treatments. A, Representative images showing the fluorescent expression of the Zn2+ sensor in melanocytes in embryos with different treatments. B, Emission spectra of the Zn2+ sensor in melanocytes of embryos with different treatments. C, The emission ratio of citrine (∼520 nm) over cerulean (∼460 nm) as a function of Zn2+ concentration. D-E, The expression level of dct in wild-type (D) and slc30a1 mutants (E) with different treatments detected by qPCR. F-G, Whole-mount in situ hybridization of dct in wild-type (F) and mutant embryos (G) with different treatments from 24 h to 48 hpf. Embryos were collected at 48 hpf. Increased dct staining is indicated by red arrows. H, Representative images of PH3 immunostaining of wild-type and slc30a1 mutant embryos with different treatments at 48 hpf. I, Summary of PH3-positive cells in the back skin of wild-type and mutant embryos. J, Summary of PH3-positive cells in the eyes of wild-type and mutant embryos.*p < 0.05, **p < 0.01, ***p < 0.001 and n.s., not significant. (For interpretation of the references to colour in this figure legend, the reader is referred to the web version of this article.) |