
- Title
-
A missense mutation in the proprotein convertase gene furinb causes hepatic cystogenesis during liver development in zebrafish
- Authors
- Ellis, J.L., Evason, K.J., Zhang, C., Fourman, M.N., Liu, J., Ninov, N., Delous, M., Vanhollebeke, B., Fiddes, I., Otis, J.P., Houvras, Y., Farber, S.A., Xu, X., Lin, X., Stainier, D.Y.R., Yin, C.
- Source
- Full text @ Hepatol Commun
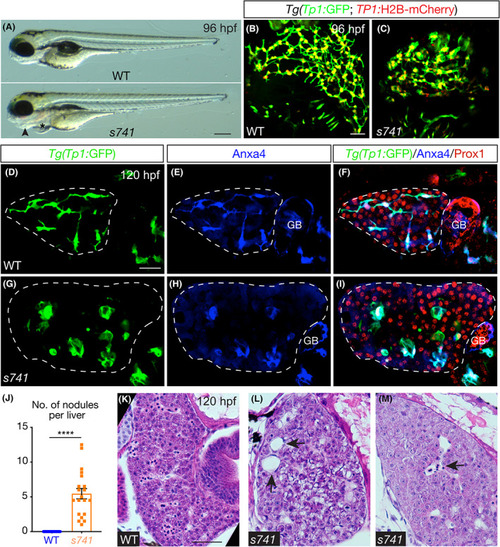
s741 mutants develop hepatic nodules composed of intrahepatic biliary cells. (A) Live wild‐type (WT; top) and s741 mutant (bottom) larvae at 96 h pst fertilization (hpf). Lateral views; anterior is on the left. Arrowhead points to the degenerating pharyngeal arches and asterisk marks the pericardial edema. (B,C) Confocal three‐dimensional (3D) projections of larvae expressing Tg(Tp1:GFP [green fluorescent protein]) (green) and Tg(Tp1:H2B‐mCherry) (red) transgenes in the intrahepatic biliary cells. (D–I) Confocal single‐plane images of the livers. (D,G) Tg(Tp1:GFP) transgene expression marks the intrahepatic biliary cells. (E,H) Annexin A4 (Anxa4) antibody stains the biliary cells.[ 50 ] (F,I) Merged images. Prox1 antibody labels the nuclei of hepatocytes and biliary cells. (B–I) Ventral views; anterior is to the top. (J) Numbers of Tg(Tp1:GFP)+ nodules (mean ± SEM) in the liver of WT (blue) and s741 mutant (orange) larvae at 96 hpf. A nodule was defined as a cluster of two or more Tg(Tp1:GFP)+ cells that maintained one or no interconnecting ducts with other biliary cells. Each dot represents individual liver. Statistical significance was calculated by two‐tailed Student's t test: ****p < 0.0001. (K–M) Hematoxylin and eosin stain of larval livers. Arrows in (L) point to cystic spaces that are entirely surrounded by hepatocytes and/or cholangiocytes. Arrow in (M) marks a cystic space that is lined by endothelium and contains red blood cells. Scale bars: 70 μm (A); 30 μm (B–I); and 50 μm (K–M). For experiments in (A)–(I) and (K)–(M), 10 WT and 10 mutants were examined and all of them exhibited the representative phenotypes. GB, gallbladder. |

s741 mutants form fluid‐filled cysts in the liver. (A–F) Fluorescent micrographs of larval livers showing that the mutant liver retained BODIPY in the nodules. (C,D) Fluorescent micrograph images under higher magnification with Tg(Tp1:ras‐mCherry) (red) transgene that marked the biliary cells. Twenty WT and 20 mutants were examined and all showed the representative phenotype. (G,H) Confocal 3D projections of the hepatopancreatic ductal system stained by Anxa4 antibody. Red arrows point to the gallbladder. (A–D,E–F) Lateral views taken from the left and right side of the fish, respectively. Anterior is on the left. (I,J) Confocal 3D projections showing the biliary cells marked by Tg(Tp1:GFP) expression (green) and bile canaliculi stained by bile salt export pump (BSEP) antibody. (G–J) Ventral views; anterior is on the top. Ten WT and 10 mutants were examined and all showed the representative phenotypes. (K,L) Representative transmission electron microscopy (TEM) images of the bile canaliculi (outlined by dashed line) at 96 hpf. Asterisks point to actin microvilli within the bile canaliculi. Six WT and 6 mutants were examined. Scale bars: 50 μm (A,B,E,F); 30 μm (C,D,G–J); and 2 μm (K,L). |

A missense mutation in the furinb gene is responsible for the cystic phenotype in s741 mutants. (A) Genome view of linkage analysis using SNPtrack. Log likelihood analysis (red line) returned an approximate 1.4‐Mb interval on linkage group 25 for the presumptive mutation. The homozygosity score (green) suggested two candidate mutations in the muc2.2 and furinb genes. (B) Sequencing of complementary DNA from s741 mutants and WT siblings. Mutants bear a T‐to‐C mutation (indicated by *) near the C terminus, leading to a V‐to‐A amino acid change. (C) Domain diagram of Furinb protein. The V‐to‐A change occurs within the cytoplasmic domain (cd). (D) Whole‐mount in situ hybridization detecting furinb transcript in WT at 96 hpf. Lateral view; anterior is on the left. (E) Quantitative polymerase chain reaction (PCR) analysis comparing furinb transcripts in the WT and s741 mutant larval livers at 96 hpf. Triplicates were performed. The results are represented as relative expression levels normalized to the housekeeping gene eef1a1l1 (mean ± SEM). Statistical significance was calculated by two‐tailed Student's t test: p = 0.7877. (F–I) Confocal 3D projections showing uninjected control WT and s741 mutant larvae (F,H) and larvae injected with WT furinb messenger RNA (mRNA) (G,I). Phalloidin (purple) stained for F‐actin and Tg(Tp1:GFP) expression (green) labeled the intrahepatic biliary cells. (J) Numbers of cysts per liver (mean ± SEM) in control and WT furinb mRNA‐injected larvae. Each dot represents an individual liver. Statistical significance was calculated by one‐way analysis of variance (ANOVA) and Tukey's post‐hoc test: ****p < 0.0001. (K–M) Confocal 3D projections showing the intrahepatic bile ducts marked by Tg(Tp1:GFP) expression. At least five fish per genotype were examined and all showed the same phenotypes. (F–I,K–M) Ventral views; anterior is to the top. Scale bars: 70 μm (D) and 20 μm (F–I,K–M). Cys‐RR, cysteine‐rich region; pro, pro‐domain; Sp, signal peptide; Tm, transmembrane domain. |

The mutant Furinb protein acts within the biliary cells to disrupt bile duct morphogenesis. (A) Schematic diagram of the genetic mosaic analysis for determining the cell autonomy of the mutant Furinb function. (B,C) Representative results of the genetic mosaic analysis. (B) WT donor cells transplanted into the s741 mutant host liver (6 of 6 host fish exhibited the representative phenotype). (C) s741 mutant donor cells transplanted into the WT host liver (10 of 10 host fish exhibited the representative phenotype). In both (B) and (C), the WT biliary cells expressed Tg(Tp1:ras‐mCherry) (red) and the s741 mutant biliary cells expressed Tg(Tp1:GFP) (green). (D–I) Confocal 3D projections of larvae stained with biliary marker Anxa4. Ventral view; anterior is on the top. (J,K) Numbers (mean ± SEM) of cysts per liver (J) and percentages of livers with cysts based on Anxa4 staining (K). In (J), each dot represents individual liver. Statistical significance was calculated by one‐way ANOVA and Tukey's post‐hoc test (J), and calculated by Fisher's exact test (J): *p < 0.05; **p < 0.01, ***p < 0.001; ****p < 0.0001. Scale bars: 30 μm (B,C) and 40 μm (D–I). |

Bile duct morphogenesis was impaired in s741 mutants. (A–F) Time‐course analysis of bile duct morphogenesis. Tg(Tp1:GFP) expression marks the intrahepatic biliary cells (green), and Prox1 antibody labels the nuclei of hepatocytes and biliary cells (red). In (E), arrows point to the interconnecting ducts between biliary cells. Arrowheads mark biliary cell clusters that did not connect to other biliary cells. Confocal 3D projections; ventral view; anterior is on the top. Eight WT and 8 mutants were collected at each time point, and all showed the representative phenotypes. (G,H) Snapshots of time‐lapse live imaging of Tg(Tp1:GFP)+ biliary cells in WT (n = 3) and s741 mutants (n = 3). Arrowheads point to the same groups of biliary cells over time. Asterisk in (G) shows the new interconnecting ducts formed by the three biliary cells marked by arrowheads. Asterisk in (H) shows the loss of the pre‐existing connecting duct between the two biliary cells marked by arrowheads. Confocal 3D projections; lateral view; anterior is on the left. (I,J) Larval livers stained with Phalloidin to label F‐actin. (I',J') The same samples as (I) and (J) with Tg(Tp1:GFP) expression marking the biliary cells (green). (K,L) Larval livers stained with acetylated‐tubulin/acetylTub antibody for stabilized microtubules (red), 4′,6‐diamidino‐2‐phenylindole (DAPI) for nucleus (blue), and Tg(Tp1:GFP) expression for biliary cells (green). (K',L') Schematic diagrams of the biliary cells shown in (K) and (L). Nuclei and acetylated‐tubulin staining are shown. (M,N) Larval livers stained with Arl13b antibody for primary cilia (red), γ‐tubulin for basal bodies (purple), DAPI for nucleus (blue), and Tg(Tp1:GFP) expression for biliary cells (green). (M',N') The same images as in (M) and (N) but with only Arl13b staining. The biliary cells, which are outlined by dashed lines, lacked obvious Arl13b staining, whereas the neighboring cells had distinct primary cilia marked by Arl13b (white arrowheads in [M]–[N']). Inserts in (M) and (N) show high magnification images of representative primary cilia marked by arrowheads. (I–N) Confocal single plane images. Vibratome sections. Ten WT and 10 mutants were examined and all showed the representative phenotypes. Scale bars: 30 μm (A–F); 20 μm (G–J'); and 10 μm (K–N'). |

The s741 mutation causes mislocalization of Furinb, which triggers endoplasmic reticulum (ER) stress. (A) Gene‐set enrichment analysis (GSEA) identified gene sets that were significantly altered in s741 mutant livers with nominal p value < 0.05 and false discovery rate (FDR) < 0.01. Gene sets were ranked by normalized enrichment score (NES). (B) GSEA plot shows a significant enrichment of unfolded protein response (UPR) pathway in s741 mutant livers compared with WT livers. (C–F) TEM images of hepatocytes (C,E) and biliary cells (D,F). Biliary cells are outlined by orange dashed line in (D) and (F). (D') and (F') show the boxed areas in (D) and (F) under high magnification. Arrows in (E) and (F') point to dilated ER. Three WT and three mutants were examined. Scale bar: 1 μm. (G,H) Confocal single‐plane images showing the expression of WT and s741 mutant Furinb‐GFP (fb‐GFP) fusion proteins in the biliary cells marked by Tg(Tp1:ras‐mCherry) expression. Sixteen WT‐fb‐GFP fish and 25 mut‐fb‐GFP fish from three rounds of injection were examined, and all had the representative protein localization. Scale bar: 10 μm. (I) Numbers (mean ± SEM) of hepatic cysts as revealed by Tg(Tp1:GFP) expression in the larvae after treatments with 10 μmol/L 4‐4‐phenylbutyric acid (4‐PBA), 1 μg/mL tunicamycin (TM), or both from 72 hpf to 120 hpf. Each dot represents an individual liver. Statistical significance was calculated by one‐way ANOVA and Tukey's post‐hoc test: *p < 0.05; ***p < 0.001; ****p < 0.0001. ES, enrichment score; G, glycogen; M, mitochondria; N, nucleus. |

Rapamycin treatment reduces the number of hepatic cysts in s741 mutants. (A) GSEA plot shows a significant enrichment of mammalian target of rapamycin complex 1 (mTORC1) signaling in s741 mutant livers. (B–E) Confocal 3D projections of Tg(Tp1:GFP)+ biliary cells after DMSO or 5 μmol/L rapamycin treatment from 72 hpf to 120 hpf. Ventral views; anterior is on the top. Scale bar: 30 μm. (F) Numbers (mean ± SEM) of liver cysts after chemical treatments. Each point represents an individual liver. (G) Quantitative real‐time PCR analyses showing the hepatic expression of UPR response genes in WT and s741 mutants after DMSO or rapamycin treatment from 72 hpf to 120 hpf. Triplicates were performed. The results are represented as relative expression normalized to the housekeeping gene eef1a1l1 (mean ± SEM). Statistical significance in (F) and (G) was calculated by one‐way ANOVA and Tukey's post‐hoc test: *p < 0.05; **p < 0.01; ***p < 0.001; ****p < 0.0001. atf6, activating transcription factor 6; atf4a, activating transcription factor 4a; xbp1‐t, x‐box binding protein 1‐total; xbp1‐s: x‐box binding protein 1‐splicing; hspa5/bip: heat shock protein family A (Hsp70) member 5; dnajc3a: Dnaj (Hsp40) homolog, subfamily C, member 3a; edem1: ER degradation enhancing α‐mannosidase like protein 1; hsp90b1/grp94: heat shock protein 90 β family member 1; ddit3/chop: DNA damage inducible transcript 3. |