
- Title
-
A Novel Laser-Based Zebrafish Model for Studying Traumatic Brain Injury and Its Molecular Targets
- Authors
- Tikhonova, M.A., Maslov, N.A., Bashirzade, A.A., Nehoroshev, E.V., Babchenko, V.Y., Chizhova, N.D., Tsibulskaya, E.O., Akopyan, A.A., Markova, E.V., Yang, Y.L., Lu, K.T., Kalueff, A.V., Aftanas, L.I., Amstislavskaya, T.G.
- Source
- Full text @ Pharmaceutics

Laser set-up for precise targeted focused radiation system. |
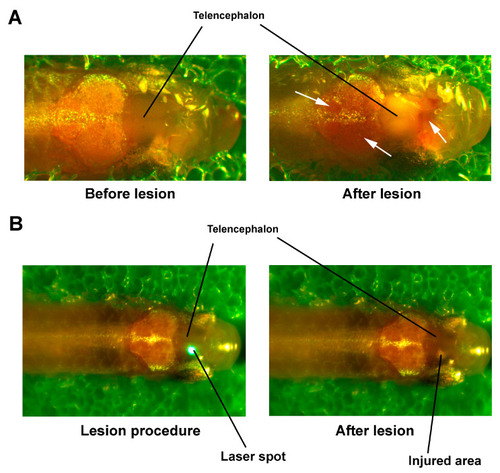
Laser-induced injury of the telencephalon in zebrafish. (A) Trauma of the whole telencephalon. White arrows show hemorrhages. (B) Local lesion of the right telencephalon. PHENOTYPE:
|
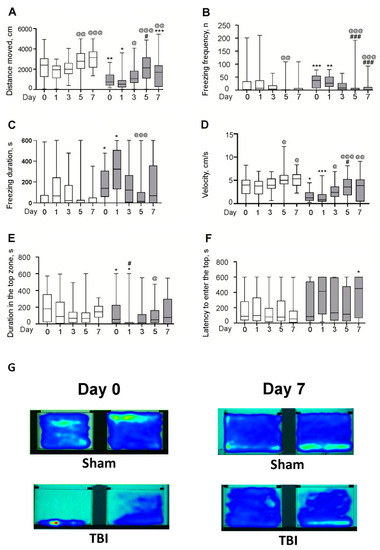
Effects of the laser-induced brain lesion (TBI model) on the behavior of zebrafish in the novel tank test on Days 0 (30 min after the lesion), 1, 3, 5, and 7 after the injury. General locomotion was evaluated by the distance traveled (A), the frequency (B) and the duration (C) of freezing, and by mean velocity (D). Cumulative duration in the top zone (E) and the latency to enter the top zone (F) served as indices of anxiety. White bars represent Sham groups; grey bars—TBI groups. Data are expressed as the median with first and third quartiles of the values obtained in an independent group of animals (n = 24–36 per group). * p < 0.05, ** p < 0.01, *** p < 0.001 vs. Sham group on the same day after the injury; # p < 0.05, ### p < 0.001 vs. TBI group on Day 0; @ p < 0.05, @@ p < 0.01, @@@ p < 0.001 vs. the same group (Sham or TBI) on Day 1. (G) Heatmap plots integrally reflecting the position in a tank of an animal during the test for two zebrafish from each group of TBI and Sham groups on Day 0 (30 min after injury) and Day 7. PHENOTYPE:
|

Effects of the laser-induced lesion (TBI model) on zebrafish whole-body cortisol on Day 0 (30 min after the lesion), 1, 3, 5, and 7 days after the injury. White bars represent Sham groups, grey bars—TBI groups; hatched bar—intact zebrafish. Data are expressed as mean ± SEM. *** p < 0.001 vs. Sham group on Day 0; ^^ p < 0.01 vs. Intact zebrafish on Day 0. PHENOTYPE:
|

Effects of laser-induced lesion (TBI model) on the neuromorphology of the telencephalon one day after the injury in zebrafish. Representative images of brain cryosections of fish from the TBI group stained with hematoxylin and eosin. Black arrows show dilated vessels, white arrows—hemorrhage, yellow arrows—edema. Magnification, ×200. PHENOTYPE:
|
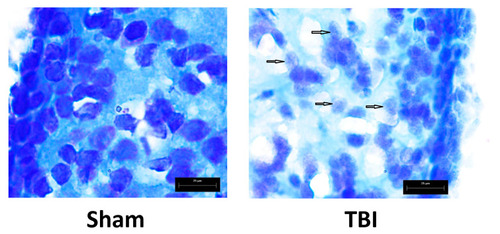
Effects of laser-induced lesion (TBI model) on neuromorphology of the telencephalon one day after the injury in zebrafish. Representative images of Nissl staining; arrows show degenerating neurons. Magnification, ×1000. PHENOTYPE:
|

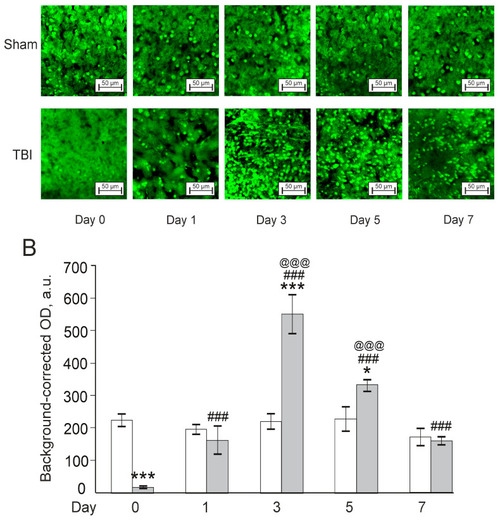
Effects of laser-induced lesion (TBI model) on the expression of NeuN in the telencephalon on Day 0 (30 min after the lesion), Days 1, 3, 5, and 7 after the injury in zebrafish. (A): Representative images of NeuN immunoreactivity in the telencephalon; magnification, × 200. (B): Quantitative results. White bars represent the Sham groups; grey bars—TBI groups. The data are expressed as mean ± SEM (n = 3–4 per group). ** p < 0.01, *** p < 0.001 vs. Sham group on the same day after the injury; ### p < 0.001 vs. TBI group on Day 0; @ p < 0.05, @@@ p < 0.001 vs. TBI group on Day 1; ++ p < 0.01 vs. TBI group on Day 3. |
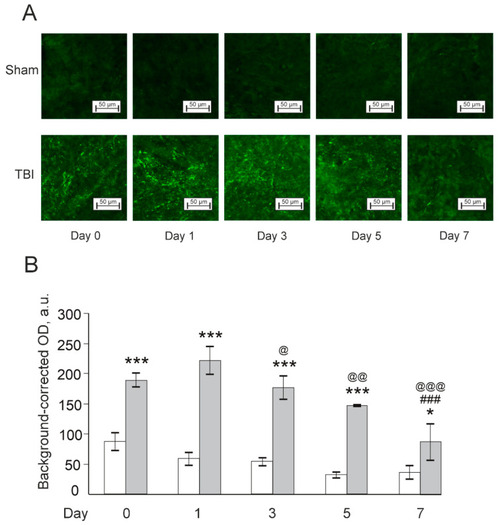
Effects of laser-induced lesion (TBI model) on the expression of Bdnf in zebrafish telencephalon on Day 0 (30 min after the lesion), Days 1, 3, 5, and 7 after the injury. (A): Representative images of Bdnf immunoreactivity in the telencephalon; magnification, ×200. (B): Quantitative results. White bars represent Sham groups, grey bars TBI groups. The data are expressed as mean ± SEM (n = 3–4 per group). * p < 0.05, *** p < 0.001 vs. Sham group on the same day after the injury; ### p < 0.001 vs. TBI group on Day 0; @@@ p < 0.001 vs. TBI group on Day 1. |

Effects of laser-induced lesion (TBI model) on the expression of Hif1a in zebrafish telencephalon on Day 0 (30 min after the lesion), Days 1, 3, 5, and 7 after the injury. (A): Representative images of Hif1a immunoreactivity in the telencephalon; magnification, ×200. (B): Quantitative results. White bars represent Sham groups, grey bars TBI groups. Data are expressed as mean ± SEM (n = 3–4 per group). ** p < 0.01, *** p < 0.001 vs. Sham group on the same day after the injury; # p < 0.05, ## p < 0.01 vs. TBI group on Day 0; @@@ p < 0.001 vs. TBI group on Day 1. |
Effects of laser-induced lesion (TBI model) on the expression of microglial marker Iba1 in zebrafish telencephalon on Day 0 (30 min after the lesion), Days 1, 3, 5, and 7 after the injury. (A): Representative images of Iba1 immunoreactivity in the telencephalon; magnification, ×200. (B): Quantitative results. White bars represent Sham groups, grey bars TBI groups. Data are expressed as mean ± SEM (n = 3–4 per group). * p < 0.05, *** p < 0.001 vs. Sham group on the same day after the injury; ### p < 0.001 vs. TBI group on Day 0; @ p < 0.05, @@ p < 0.01, @@@ p < 0.001 vs. TBI group on Day 1. |