
- Title
-
A homozygous MED11 C-terminal variant causes a lethal neurodegenerative disease
- Authors
- Calì, E., Lin, S.J., Rocca, C., Sahin, Y., Al Shamsi, A., El Chehadeh, S., Chaabouni, M., Mankad, K., Galanaki, E., Efthymiou, S., Sudhakar, S., Athanasiou-Fragkouli, A., Çelik, T., Narlı, N., Bianca, S., Murphy, D., De Carvalho Moreira, F.M., SYNaPS Study Group, Andrea Accogli, ., Petree, C., Huang, K., Monastiri, K., Edizadeh, M., Nardello, R., Ognibene, M., De Marco, P., Ruggieri, M., Zara, F., Striano, P., Şahin, Y., Al-Gazali, L., Abi Warde, M.T., Gerard, B., Zifarelli, G., Beetz, C., Fortuna, S., Soler, M., Valente, E.M., Varshney, G., Maroofian, R., Salpietro, V., Houlden, H.
- Source
- Full text @ Genet. Med.
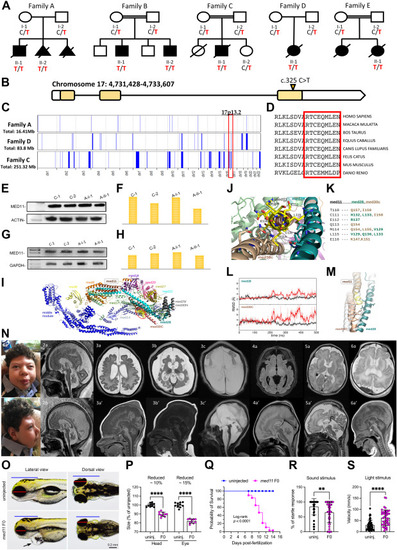
Figure 1. Clinical, molecular and neuroradiological features of the affected individuals. A. Pedigrees of affected families. Solid black indicates affected. Genotype, where indicated, represent results of evaluation for the MED11 c.325C>T variant using Sanger sequencing. B. Structure of the MED11 gene with the variant. C. Overview of the whole regions of homozygosity (ROH) in the exome of each case from 3 families. The region of homozygosity surrounding the MED11 variant is indicated in red bracket (the homozygous variant in family A is not within an ROH). D. Conservation of the C-terminal residue of MED11 protein through different species. E. Western blotting from protein extracted from fibroblast cell lines of 1 proband, the heterozygous parent, and 2 wild-type age-matched controls. F. Analysis of the western blot using the densitometry software ImageJ after normalization relative to a housekeeping protein (actin) and calculation using a relative relationship method. G. Reverse transcription polymerase chain reaction (PCR) amplified mutant complementary DNA from messenger RNA extracted from fibroblast cell lines of 1 proband, the heterozygous parent, and 2 wild-type age-matched controls. H. Analysis of the semiquantitative PCR using the densitometry software ImageJ after normalization relative to a housekeeping gene (GAPDH) and calculation using a relative relationship method. I. Structure of the human mediator. The med11 C-terminal region affected by the nonsense variant at R109 is highlighted by a yellow surface. J. Detailed representation of the med11 C-terminal region within the med11-med28-med30C bundle structure. K. List of interactions between med11 C-terminal region and med28, med30C residues. L. Root mean square deviation values of med28 and med30C residues that interact with med11 C-terminal were calculated for the wild type (black) and the mutant (red) after med11 alignment. M. Comparison between the most representative structure of mutant med11, med28, and med30C, obtained as a medoid of the biggest cluster of the trajectory, and the crystal structure (in transparent white). N. Facial appearance of individual A-II-1 (1a and b) and representative brain abnormalities on magnetic resonance image. Individual A-II-1: progressive global neurodegeneration and atrophy involving the cerebral and cerebellar hemispheres shown at age 1 month (3a: axial T2, 3a′: sagittal T1), at 4 months (3b: axial T2, 3b′: sagittal T1), and 2 years (3c: axial T2, 3c′: sagittal T2). Note was also made of cerebral dysgyria secondary to immature cortical folding. Bilateral subdural effusions were noted secondary to the severe atrophy. Diffuse white-matter immaturity was also noted—delayed-/hypo-myelination therefore could not be excluded. Another feature noted was severe degeneration of the basal ganglia structures. Fetal scans (of the aborted fetus) at 31 weeks (2a: sagittal T2) and at 34 weeks of gestation (2b: sagittal T2) again show progressive atrophy of intracranial structures with increasing extra-axial spaces, cerebral dysgyria, and marked cerebellar atrophy. Individual B-II-1 (4a: axial FLAIR, 4a′: sagittal T2) and individual B-II-2, (5a: axial T2, 5a′: sagittal T2) showed similar features of global brain underdevelopment with cerebral dysgyria and particular cerebellar atrophy; 6a: axial T2 and 6a′: sagittal T1 images in the same affected individual showing similar features of underopercularization with cortical dysgyria, immaturity and underdevelopment of the white matter, and cerebellar atrophy. O. Morphologic phenotyping of med11 knockout animals. Control animals are shown in top panel, med11 knockout animals show small brain and small eyes; red line represents the eye diameter and blue line shows brain size. Black arrow shows heart edema. P. Quantification of head and eye size. Q. Kaplan-Meier survival curves, time shown in days, the log rank test was used for statistical analysis. R. Auditory evoked behavior response analysis of knockout animals showed reduced startle response. S. Visual startle response analysis showed increased movement after the light stimulus. |