
- Title
-
Hypoxia-induced lncRNA STEAP3-AS1 activates Wnt/β-catenin signaling to promote colorectal cancer progression by preventing m6A-mediated degradation of STEAP3 mRNA
- Authors
- Zhou, L., Jiang, J., Huang, Z., Jin, P., Peng, L., Luo, M., Zhang, Z., Chen, Y., Xie, N., Gao, W., Nice, E.C., Li, J.Q., Chen, H.N., Huang, C.
- Source
- Full text @ Mol. Cancer
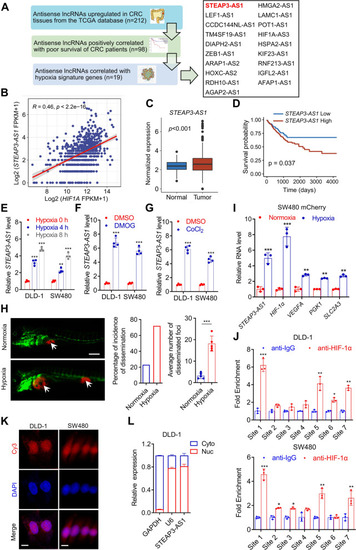
LncRNA STEAP3-AS1 is transcriptionally induced by HIF-1α under hypoxia. A Schematic diagram describing the screening process of candidate antisense lncRNAs using the TCGA dataset. B The correlation between STEAP3-AS1 and HIF1A RNA level in TCGA datasets was analyzed by Pearson correlation test. C The expression of STEAP3-AS1 in normal and CRC samples from the TCGA datasets. D Kaplan–Meier analysis of progression free survival of CRC patients with low or high STEAP3-AS1 expression according to the TCGA dataset (P = 0.037, log-rank test). E qPCR was performed to determine relative STEAP3-AS1 RNA level in DLD-1 and SW480 cells after treatment with 1% O2 for 0 h, 4 h and 8 h. F-G Relative STEAP3-AS1 expression in DLD-1 and SW480 cells treated with DMOG (1 mM) or CoCl2 (100 μM) for 48 h was determined by qPCR. H 200 SW480 cells expressing mCherry were implanted into the perivitelline space of 3dpf flk:eGFP Casper zebrafishes. After being under normoxic or hypoxic (8% O2) condition for 3 days, the zebrafishes were then monitored by stereo microscopy. Scale bar: 250 μm. I qPCR was performed to determine the relative RNA levels of STEAP3-AS1, HIF1A, VEGFA, PGK1, SLC2A3 in mCherry SW480-derived zebrafish xenograft models with or without hypoxic treatment. J ChIP assay investigating the binding capacity of HIF-1α to each HRE was conducted in DLD-1 and SW480 cells. K FISH assay was conducted to determine the subcellular location of lncRNA STEAP3-AS1 (Cy3) in DLD-1 and SW480 cells. DAPI-stained nuclei are blue. Scale bar: 10 μm. L The expression level of lncRNA STEAP3-AS1 in the subcellular fractions of DLD-1 cells was detected by qPCR. U6 and GAPDH were used as nuclear and cytoplasmic markers, respectively. Data are means ± s.d. and are representative of at least 3 independent experiments. (* P < 0.05, ** P < 0.01, and *** P < 0.001) |
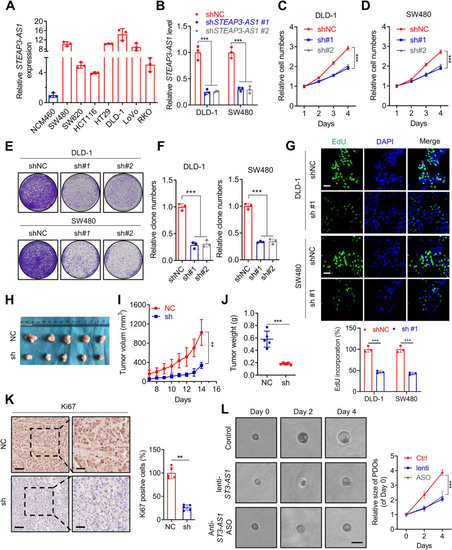
LncRNA STEAP3-AS1 promotes growth of CRC cells both in vitro and in vivo. A Basal level of STEAP3-AS1 was determined using qPCR assay in the nonmalignant human colon epithelial cell line NCM460 and several CRC cell lines (including SW480, SW620, HCT116, HT29, DLD-1, LoVo, and RKO). B qPCR analysis was performed to detect the RNA levels of STEAP3-AS1 in DLD-1 and SW480 cells with or without STEAP3-AS1 stable knock-down. C-D The growth of DLD-1 (C) and SW480 (D) cells was monitored by MTT assay over a 4-day period with or without STEAP3-AS1 knockdown. (sh#1, shSTEAP3-AS1 #1; sh#2, shSTEAP3-AS1 #2). E The effects of lncRNA STEAP3-AS1 knockdown on the proliferation of SW480 and DLD-1 cells were examined by colony formation assays. Top, DLD-1 cells; bottom, SW480 cells. (sh#1, shSTEAP3-AS1 #1; sh#2, shSTEAP3-AS1 #2). F Relative clone numbers in (E). Left, DLD-1 cells; right, SW480 cells. (sh#1, shSTEAP3-AS1 #1; sh#2, shSTEAP3-AS1 #2). G EdU assays were used to detect the proliferation rate of SW480 (bottom) and DLD-1 (top) cells with or without STEAP3-AS1 knockdown. Scale bar: 50 μm. (sh#1, shSTEAP3-AS1 #1). H Images of isolated tumors from the subcutaneous tumor mice model established using DLD-1 cells with or without STEAP3-AS1 knockdown. I-J Tumor volume (I) and weight (J) were significantly decreased in the lncRNA STEAP3-AS1 knockdown group compared with the control group. K Left, representative images of Ki67 staining of the tumor tissue; right, the statistic graph of Ki67 positive cells. Scale bar: left 50 μm, right 20 μm. L Left, brightfield images of organoids treated with lenti-shSTEAP3-AS1 or anti-STEAP3-AS1 ASO for indicated times; right, the statistic graph of relative size of PDOs. scale bar: 100 μm. Data are means ± s.d. and are representative of at least 3 independent experiments. (** P < 0.01 and *** P < 0.001) |

LncRNA STEAP3-AS1 facilitates migration and invasion of CRC cells. A Representative images of lung (left) and their H&E staining (right) from the tail vein injection model using DLD-1 cells. Scale bar: 100 μm. (sh#1, shSTEAP3-AS1 #1). B The metastatic liver colonization model was generated by inoculating DLD-1 cells into the splenic of BALB/c mice (left), or orthotopically implanting CRC xenograft into the cecum of BALB/c mice (right). Representative H&E images of livers staining are shown. Scale bar: left 100 μm, right 25 μm. (sh#1, shSTEAP3-AS1 #1). C Wound healing assay showing cell migration of DLD-1 (left) and SW480 (right) cells with or without STEAP3-AS1 knockdown. Scale bar: 100 μm. (sh#1, shSTEAP3-AS1 #1; sh#2, shSTEAP3-AS1 #2). D The statistic graph of relative migration distance in (C). (sh#1, shSTEAP3-AS1 #1; sh#2, shSTEAP3-AS1 #2). E-F Migration and invasion of DLD-1 (E) and SW480 cells (F) with or without STEAP3-AS1 knockdown were evaluated using transwell assays. Scale bar: 100 μm. (sh#1, shSTEAP3-AS1 #1; sh#2, shSTEAP3-AS1 #2). G The statistic graph of relative migration cell numbers in (E-F). Left, DLD-1 cells; Right, SW480 cells. (sh#1, shSTEAP3-AS1 #1; sh#2, shSTEAP3-AS1 #2). H EMT markers were detected by western blot in DLD-1 and SW480 cells with or without STEAP3-AS1 knockdown. (sh#1, shSTEAP3-AS1 #1). I-J qPCR analysis of the expression of EMT markers in STEAP3-AS1 knockdown or control DLD-1 (I) and SW480 (J) cells. Data are means ± s.d. and are representative of at least 3 independent experiments. (** P < 0.01 and *** P < 0.001) |
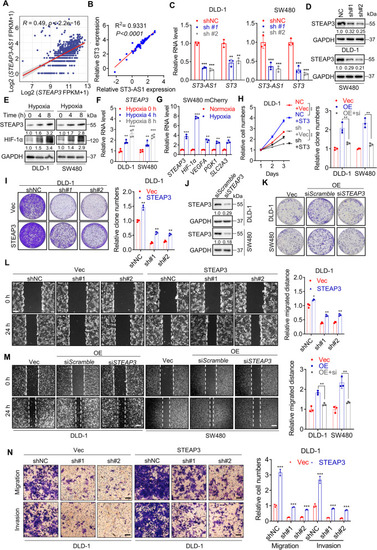
LncRNA STEAP3-AS1 positively regulates STEAP3 to promote CRC progression. A-B Correlation analysis of relative RNA level of STEAP3 and STEAP3-AS1 in TCGA datasets (A) and CRC cell lines from CCLE (B), r = Pearson’s correlation coefficient. C Relative RNA level of STEAP3-AS1 and STEAP3 in control or STEAP3-AS1-knockdown DLD-1 (left) and SW480 (right) cells determined by qPCR. (sh#1, shSTEAP3-AS1 #1; sh#2, shSTEAP3-AS1 #2). D The expression level of STEAP3 protein in control or STEAP3-AS1-knockdown DLD-1 and SW480 cells was measured by western blotting. (sh#1, shSTEAP3-AS1 #1; sh#2, shSTEAP3-AS1 #2). E-F The protein levels of STEAP3 and HIF-1α (E), and relative RNA level of STEAP3 (F) in DLD-1 and SW480 cells under hypoxia at indicated time points. G qPCR analysis of relative RNA levels of STEAP3, HIF-1α and HIF-1α target genes in mCherry SW480-derived zebrafish xenograft models under normoxia or hypoxia. H-I Relative cell numbers at serial time points (H) and colony formation (I) of control and STEAP3-AS1-knockdown DLD-1 cells with or without replenishment of STEAP3. (sh#1, shSTEAP3-AS1 #1; sh#2, shSTEAP3-AS1 #2; OE, STEAP3-AS1 overexpression). J The efficiency of siRNA-mediated STEAP3 knockdown was measured by western blotting. K The colony formation of control and STEAP3-AS1-overexpressing DLD-1 and SW480 cells treated with or without STEAP3 siRNA. (OE, STEAP3-AS1 overexpression). L Wound healing assay (left) and relative migration distance (right) of control and STEAP3-AS1-knockdown DLD-1 cells with or without reintroduction of STEAP3. Scale bar: 100 μm. (sh#1, shSTEAP3-AS1 #1; sh#2, shSTEAP3-AS1 #2). M Wound healing assay (left) and relative migration distance (right) of control and STEAP3-AS1-overexpressing DLD-1 cells treated with or without STEAP3 siRNA. Scale bar: 100 μm. (OE, STEAP3-AS1 overexpression). N Migration and invasion of control and STEAP3-AS1-knockdown DLD-1 cells with or without reintroduction of STEAP3. Scale bar: 100 μm. (sh#1, shSTEAP3-AS1 #1; sh#2, shSTEAP3-AS1 #2). Data are means ± s.d. and are representative of at least 3 independent experiments. (* P < 0.05, ** P < 0.01, and *** P < 0.001) |

STEAP3-AS1 binds to YTHDF2 to prevent m6A-mediated degradation of STEAP3 mRNA. A The potential binding proteins of STEAP3-AS1 predicted by the AnnoLnc2 database. B m6A modification of STEAP3 mRNA and STEAP3-AS1 in SW480 and DLD-1 cells analyzed by MeRIP. C The interaction between YTHDF2 and STEAP3-AS1 in DLD-1 and SW480 cells as measured by RNA pulldown. Anti-sense was used as a negative control. D RIP analysis of the binding of YTHDF2 to STEAP3 mRNA and STEAP3-AS1 in DLD-1 and SW480 cells. E The binding of YTHDF2 to indicated truncated STEAP3-AS1 in SW480 and DLD-1 cells measured by RNA pulldown. F RNA pulldown analysis of the interaction between YTHDF2 and STEAP3 mRNA in control or STEAP3-AS1-knockdown DLD-1 and SW480 cells. G RIP analysis of the interaction between YTHDF2 and STEAP3 mRNA in DLD-1 and SW480 cells with or without STEAP3-AS1 knockdown. (sh#1, shSTEAP3-AS1 #1). H Relative mRNA level of STEAP3 in control or STEAP3-AS1-knockdown DLD-1 and SW480 cells treated with actinomycin D (2.5 μM) at indicated time points. (sh#1, shSTEAP3-AS1 #1; sh#2, shSTEAP3-AS1 #2). I Relative STEAP3 mRNA level in control or STEAP3-AS1-overexpressing HCT116 cells treated with actinomycin D (2.5 μM) at indicated time points. (OE, STEAP3-AS1 overexpression). Data are means ± s.d. and are representative of at least 3 independent experiments. (** P < 0.01 and *** P < 0.001, NS, not significant) |

STEAP3-AS1 activates wnt/β-catenin signaling to promote CRC progression. A Gene-Concept Network of enriched Wnt signaling pathways based on RNA-sequencing analysis of control and STEAP3-AS1-knockdown DLD-1 cells. B Heatmap of RNA sequencing results from Fig. 6A showing the expression patterns of Wnt signaling pathway-related genes. C Western blotting analysis showing the expression level of cytoplasmic (Cyto) and nuclear (Nuc) β-catenin in DLD-1 and SW480 cells with or without STEAP3-AS1 knockdown. The GSK3β inhibitor CHIR-99021 was used as a positive control. D-E The expression level of cytoplasmic (Cyto) and nuclear (Nuc) β-catenin in control or STEAP3-AS1-overexpressing DLD-1 (D) and HCT116 (E) cells was analyzed by western blotting. F TOP/FOP flash reporter assay in control or STEAP3-AS1-knockdown DLD-1 and SW480 cells. The GSK3β inhibitor CHIR-99021 was used as a positive control. G TOP/FOP flash reporter assay in control or STEAP3-AS1-overexpressing HCT116 (left) and DLD-1 (right) cells. H Relative RNA levels of several Wnt members and the Wnt inhibitor protein DKK1 in control or STEAP3-AS1-knockdown DLD-1 and SW480 cells. The GSK3β inhibitor CHIR-99021 was used as a positive control. Data are means ± s.d. and are representative of at least 3 independent experiments. (** P < 0.01 and *** P < 0.001) |

STEAP3-AS1/STEAP3-mediated Fe2+ inactivates GSK3β to stimulate wnt/β-catenin signaling. A Relative cellular Fe2+ level in DLD-1 and SW480 cells with or without STEAP3-AS1 knockdown. B TOP/FOP flash assay for detecting the transcriptional activity of Wnt/β-catenin signaling in control or STEAP3-AS1 knockdown DLD-1 cells with or without FeSO4 (100 μM) treatment for 48 h. C After treatment with or without FeSO4 (100 μM) for 48 h, control or STEAP3-AS1 knockdown DLD-1 and SW480 cells were analyzed to show the subcellular distribution of β-catenin using nuclear/cytoplasmic fractionation and subsequent WB analysis. (Cyto, cytoplasm; Nuc, nucleus). D Control or STEAP3-AS1 knockdown DLD-1 and SW480 cells were seeded on slides on 24 well-plates overnight and treated as in (C), IF assay was conducted to detect the subcellular distribution of β-catenin. Scale bar: 10 μm. (E-F) Control or STEAP3-AS1 knockdown DLD-1 and SW480 cells were seeded on a culture dish overnight and treated as in (C). Immunoprecipitation (IP) and WB analysis were performed to observe the interaction between β-catenin and GSK3β. G The efficiency of siRNA-mediated GSK3β knockdown was measured by western blotting. H The colony formation of control and STEAP3-AS1 knockdown DLD-1 and SW480 cells treated with or without GSK3β siRNA. I Wound healing assay and relative migration distance of control and STEAP3-AS1-knockdown DLD-1 and SW480 cells treated with or without GSK3β siRNA. Scale bar: 100 μm. J Control or STEAP3-AS1 knockdown DLD-1 and SW480 cells were treated as in (C). Cell growth was performed by MTT assay over a 3-day period. (sh#1, shSTEAP3-AS1 #1). K Control or STEAP3-AS1 knockdown DLD-1 cells were treated as in (C). Migration and invasion of DLD-1 cells were evaluated by transwell assays. Scale bar: 100 μm. (sh#1, shSTEAP3-AS1 #1; sh#2, shSTEAP3-AS1 #2). Data are means ± s.d. and are representative of at least 3 independent experiments. (** P < 0.01 and *** P < 0.001) |