
- Title
-
Covalent Proteomimetic Inhibitor of the Bacterial FtsQB Divisome Complex
- Authors
- Paulussen, F.M., Schouten, G.K., Moertl, C., Verheul, J., Hoekstra, I., Koningstein, G.M., Hutchins, G.H., Alkir, A., Luirink, R.A., Geerke, D.P., van Ulsen, P., den Blaauwen, T., Luirink, J., Grossmann, T.N.
- Source
- Full text @ J. Am. Chem. Soc.

(a) Scheme of the divisome complex showing key subunits. Early assembly proteins (light gray) are recruited to the midcell plane first. FtsA and ZipA anchor FtsZ protofilaments on the inner membrane. FtsZ is a prokaryotic tubulin homologue and forms a ring at the nascent division site, the so-called Z ring, during cell division. This ring serves as a platform for the peptidoglycan synthesis machinery.45 FtsK is recruited to assist in chromosome segregation and in turn recruits the FtsQBL complex, which serves as a structural hub for recruitment of late assembly proteins (dark gray). Interaction of FtsN with the FtsQBL complex indicates the completion of divisome complex formation.11,12 (b) Crystal structure (PDB: 6h9o) of periplasmic FtsQ domains (white) in a complex with FtsB-derived peptide 24 (blue). FtsB residues essential for binding are shown in a stick representation.23 (c) Top: sequence of peptide 24-derived macrocycles including associated secondary structure elements in the FtsQ-bound state. Bottom: synthesis sketch of macrocyclic peptides. (d) Fluorescence polarization (FP) measurements using fluorescein-labeled analogues of 24 (c = 10 nM) and FtsQ(50–276) (c = 0.06 nM–100 μM). The table provides KD-values for macrocyclic peptides bound to FtsQ(50–276). Peptide cross-link lengths are indicated (6–13 carbon atoms; for peptide details, see Table S1). All measurements were performed in triplicate (n = 3 replicates, error bars = SD). |
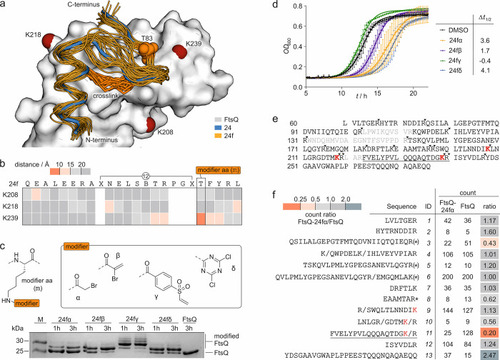
(a) Overlay of peptide 24 (blue, crystal structure, PDB: 6h9o) bound to FtsQ (white) with binding poses of 24f (orange) derived from MD simulations (snapshots every 10 ns from three independent 100 ns simulations; the pdb file with atomic coordinates is provided in the Supporting Information). The cross-links in 24f (orange stick representation) and FtsQ lysine residues in proximity to the binding site (d̅ < 15 Å, red spheres for Nε) are highlighted. (b) Heat map of the average distance between the Nε of the selected lysine and the Cβ of 24f residues over a 400 ns MD simulation (Table S2). (c) Top: structure of the four selected modifiers (α, β, γ, and δ) installed in a modified amino acid (m), which was introduced at position T83 of 24f. Bottom: 17% Tris/Tricine PAGE (protein modification assay) assessing peptide binding to FtsQ(50–276). Covalent inhibitors 24fα–δ (c = 125 μM; for peptide details, see Table S3) were incubated with FtsQ(50–276) (c = 50 μM) for 1 or 3 h. Up-shifted bands are indicative of modified FtsQ. (d) Growth assay using E. colilptD4213 (imp) after treatment with inhibitors 24fα–δ (c = 50 μM). Optical density at 600 nm (OD600) was measured every 15 min over 22 h. Measurements were conducted in triplicate (n = 3 technical replicates, error bars = SD). (e) Sequence coverage for unmodified FtsQ(50–276) after tryptic digest in the MS/MS experiment (only sequence fragments with a count of >1 were included, and missing sequence fragments are shown in gray; the solid inverted triangle indicates the protease cleavage site). (f) List of identified sequences (count of >1). Counts for 24fα-modified and unmodified FtsQ as well as the corresponding count ratio are shown (* oxidized methionine, (*) oxidized and non-oxidized methionine, / additional cleavage site; for full list of fragments, see Table S4). |

(a) Overview of truncated versions of 24fα. The positions of the cross-linking amino acids (X, light gray) and of the modifier-bearing amino acid (m, red) are indicated (for peptide details, see Table S3). (b) Growth assay using E. colilptD4213 (imp) after treatment with 24fα, 20fα, 17fα, and 15fα (c = 25 μM). The optical density at 600 nm (OD600) was measured every 15 min over 22 h. Measurements were conducted in triplicate (n = 3 technical replicates, error bars = SD). (c) Growth assay using E. colilptD4213 (imp) after treatment with 17fα–δ (c = 50 μM). The optical density at 600 nm (OD600) was measured every 15 min over 22 h. Measurements were conducted in triplicate (n = 3 technical replicates, error bars = SD). (d) 17% Tris/Tricine PAGE (protein modification assay) assessing peptide binding to FtsQ(50–276). Covalent inhibitors 17fα–δ (c = 125 μM; for peptide details, see Table S3) were incubated with FtsQ(50–276) (c = 50 μM) for 1 or 3 h. Up-shifted bands are indicative of modified FtsQ. (e) MS of FtsQ(50–276) after 17fα treatment. Signals corresponding to unmodified (gray) and 17fα-labeled FtsQ(50–276) are indicated. Obtained masses (obtained by deconvolution) are shown (calculated masses, FtsQ: 26939 g/mol, FtsQ-17fα: 29061 g/mol). The obtained mass difference (ΔMW = 2124 g/mol) corresponds well with the one expected after a reaction with 1 equiv of 17fα (ΔMW = 2122 g/mol; for details, see Figure S9). (f) Concentration-dependent effect of 17fα and 15fα (c = 0.78 μM–2100 μM) on the growth of E. colilptD4213 (imp) after 15 h. All measurements were performed in triplicate (n = 3 replicates, error bars = SD). |
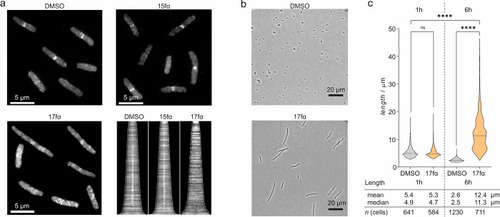
(a) Representative fluorescent microscopy pictures (scale bar = 5 μm) showing FtsB-mNG localization (white) in E. colilptD4213 (imp) in the presence of either DMSO, 15fα, or inhibitory peptide 17fα (both c = 100 μM) 60 min after addition. The corresponding demograph shows the fluorescence intensity along the longitudinal axis of treated cells (cells ordered by lengths). The midcell fluorescence intensity consistent with the presence of FtsB-mNG is lost for 17fα-treated cells as indicated by the absence of a white signal at the center of the x axis compared to the others. (b) Morphology of representative E. coliLptD4213 cells treated with either DMSO or 17fα (c = 100 μM) after 6 h (scale bar = 20 μm). The violin plot shows the corresponding cell length distribution of samples treated with either DMSO or 100 μM 17fα after 1 and 6 h. Significance was determined by the Kruskal–Wallis test and Dunn’s multiple-comparison test (ns: p > 0.05, ****p < 0.0001). |

(a) Representative pictures of uninfected and infected zebrafish larvae. Top left: Uninfected larvae. In the remaining pictures, zebrafish larvae were infected with E. coli 87 (CFU = 255) encoding fluorescent mScarlet. Subsequently, they were either treated with 17fα (c = 70 μM), L8S1 (c = 3.125 μM), or a combination of both. (b) Relative share of surviving zebrafish larvae after 24 h as determined by heartbeat depending on the treatment regime. (c) Effect of different treatments on the infection progress after 24 h as determined by quantification of red pixels per larvae (zebrafish larvae pictures can be found in Figure S14). All measurements were performed in quadruplicate (n = 4 replicates with 15 Zebrafish larvae per condition, error bars = SEM). Significance was determined by one-way ANOVA and Dunnet’s multiple-comparison test (*p < 0.05, **p < 0.01, ***p < 0.001, and ****p < 0.0001). |