FIGURE SUMMARY
Title

Development of a Multicellular 3D Tumor Model to Study Cellular Heterogeneity and Plasticity in NSCLC Tumor Microenvironment

Authors
Arora, L., Kalia, M., Dasgupta, S., Singh, N., Verma, A.K., Pal, D.
Source
Full text @ Front Oncol

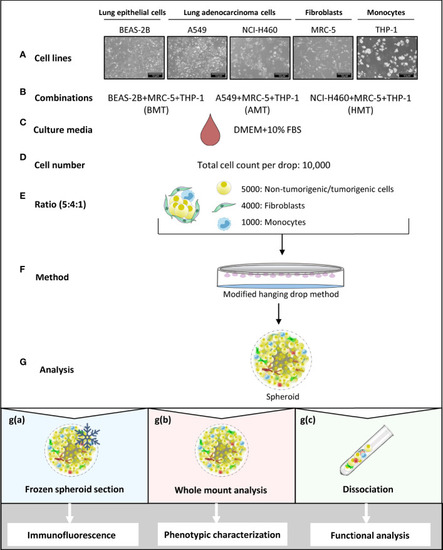
Schematic representation of multicellular 3D spheroid development protocol and their use in different experimental analysis. (A–F) Normal lung epithelial cells (BEAS-2B), lung adenocarcinoma cells (A549 and NCI-H460), MRC-5 fibroblasts, and THP-1 monocytes are used to prepare multicellular tumor spheroids (BMT, AMT, and HMT) in DMEM+10% FBS growth medium. After optimization, as detailed in the result section, 10,000 cells per 25 μl drop in a ratio of 5:4:1 (BEAS-2B/A549/NCI-H460: MRC-5: THP-1) are taken to prepare spheroids using hanging drop method. (G) Different techniques are used for spheroid analysis; g(a). Spheroids frozen at low temperature (-80°C) were sectioned and stained with fluorescent-labeled antibodies for immunofluorescence analysis of cell proliferation, hypoxia, and cell plasticity in the spheroid microenvironment. g(b) Whole-mount analysis was performed for spheroid characterization (cell diameter, uniformity, cell viability), and functional analysis (gene expression and sprouting assays). g(c) Dissociation of multicellular spheroids by enzymatic digestion resulted in cell suspension, which was used for colony formation assay (cell proliferation), and flow cytometric analysis of cell surface markers (phenotypic characterization). Cell suspension was also used for magnetic bead-based separation of a single cell population for gene expression analysis (phenotypic characterization).

Phenotypic characterization of multicellular 3D spheroid’s morphology, viability, and cell proliferation. (A) Microscopic images of multicellular 3D spheroids composed of BEAS-2B, MRC-5, and THP-1 (BMT spheroid); A549, MRC-5, and THP-1 (AMT spheroid); and NCI-H460, MRC-5, and THP-1 (HMT spheroid) on day 4, day 7, and day 10. (B) Measurement of spheroid’s diameter on day 4, day 7, and day 10. (C) Schematic diagram (upper panel) and microscopic images (lower panel) of spheroid development at different time points displaying initial loose association of cells (days 0-3) followed by tight aggregates (days 4-8) leading to compact spheroid formation (day 9onwards). (D, E) RT-qPCR analysis of E-cadherin(D) and fibronectin(E) mRNA levels in BMT, AMT, and HMT spheroids on day 0, day 7, and day 10. (F, G)Calcein-AM and propidium iodide (PI) staining (F), and the quantification of Calcein-AM-stained live cells (G) in BMT, AMT, and HMT spheroids on day 4, day 7, and day 10(n=3). (H) Determination of acid phosphatase(APH) activity in developed spheroids(n=3). (I) RT-qPCR analysis of cell proliferation marker MKi67 in BMT, AMT, and HMT spheroids on day 4, day 7, and day 10(n=3). (J) Immunofluorescence images of Ki67 protein in day 10 spheroids section. DAPI was used for nuclei counterstaining. GAPDH is a loading control for RT-qPCR studies. Fold change for E-cadherin, fibronectin, and MKi-67gene expression was calculated keeping the spheroid cell cocktail (BEAS-2B/MRC-5/THP-1, A549/MRC-5/THP-1, and NCI-H460/MRC-5/THP-1) at day 0 as control. All experiments were performed in triplicate (n=3). Data represented as mean ± S.D. 2D vs BMT over time *p< 0.05, **p< 0.01, ***p< 0.001; BMT vs AMT over time #p< 0.05, ##p< 0.01, ###p< 0.001; BMT vs HMT over time §p< 0.05, §§p< 0.01, §§§ p< 0.001; ns, non-significant.

Fibroblast activation and monocyte TAM polarization in tumorigenic multicellular 3D spheroids. (A) Schematic diagram representing isolation of fibroblasts from 3D multicellular spheroids using anti-fibroblast microbeads-based cell sorting to examine CAF markers such as α-SMA, FSP/S100A4, and PDGF-β. (B–D) RT-qPCR analysis shows a relative abundance of α-SMA (B), FSP (C), and PDGF-β (D) mRNA levels in isolated fibroblasts of BMT, AMT, and HMT spheroids on day 0, day 7, and day 10. (E) Immunofluorescence staining of α-SMA in BMT, AMT, and HMT spheroid sections (6 micron). DAPI was used for nuclei counterstaining. (F) Schematic diagram representing isolation of macrophages from 3D multicellular spheroids using anti-human CD11b microbeads to examine TAM markers CD163 and CD206. (G) Flow cytometric analysis and quantification of CD163+ cells in BMT, AMT, and HMT spheroids on day 10. (H, I) RT-qPCR analysis of CD206 (H) and CD163 (I) gene expression in macrophages isolated from BMT, AMT, and HMT spheroids on day 0, day 7, and day 10. (J) Immunofluorescence staining of CD163 in BMT, AMT, and HMT spheroid sections (6 micron). DAPI was used for nuclei counterstaining. GAPDH is used as a loading control for RT-qPCR analysis. Fold change for CAF markers was calculated keeping MRC5 as control cells and fold change for TAM population was calculated keeping THP-1 cells as control cells. All experiments were performed in triplicate (n=3). Data represented as mean ± S.D. 2D vs BMT over time *p< 0.05, **p< 0.01, ***p< 0.001; BMT vs AMT over time ##p< 0.01, ###p< 0.001; BMT vs HMT over time §§p< 0.01, §§§p< 0.001; ns, non-significant.

Angiogenic potential of malignant 3D multicellular spheroids. (A, B) RT-qPCR analysis of endothelial cell markers gene expression such as VEGF (A) and GATA2 (B) in BMT, AMT, and HMT spheroids on day 0, day 7, and day 10. (C, D) Flow cytometric analysis (C) and quantification (D) of VE-cadherin+ cells in BMT, AMT, and HMT spheroids on day 10. (E) RT-qPCR analysis of a-SMA, FSP, CD68, CD163, and CD206 mRNA levels in CD144+ cells isolated from BMT, AMT, and HMT spheroids on day 14. (F, G) RT-qPCR analysis of endothelial cell markers (VE-cadherin, VEGF, vWF, Endoglin, and CD31) (F) and angiogenic regulators (ZEB1, FLI1, GATA2, Etv2, Ets, and Tie2) gene expression (G) in THP-1 macrophages and CD68+ cells, respectively, isolated from BMT, AMT, and HMT spheroids on day 14h. (H). Representative images of BMT, AMT, and HMT spheroids on day 21 after placing the spheroid of day 14 on a collagen matrix and maintained in endothelial cell media for 7 days. Cell sprouting (red arrow) were detected in tumor spheroids. (I) RT-qPCR analysis of eNOS gene expression in CD68+ cells of these spheroids on day 21. GAPDH was used as loading control for RT-qPCR analysis. Fold change for CD144+ cells was calculated keeping the 2Dcells(control)at day 0as control and fold change for CD68+ cells was calculated keeping THP-1 monocytes (2D) as control. All experiments were performed in triplicates (n = 3). Data represented as mean ± S.D. 2D vs BMT over time *p< 0.05, **p< 0.01, ***p< 0.001; BMT vs AMT over time ##p< 0.01, ###p< 0.001; BMT vs HMT over time §p< 0.05, §§p< 0.01, §§§p< 0.001; ns, non-significant.

Validation of 3D tumor spheroid data in zebrafish xenograft model. (A) Schematic diagram representing experimental design indicating days on which zebrafish was immunocompromised [d(-3)], mixed cell population was injected into the peritoneal cavity [d(0)], and BMT, AMT, and HMT xenografts were collected on d10 and d14. (B) Representative photographs of zebrafish on d0, and d10 of tumor development. (C) Representative photographs of zebrafish BMT, AMT, and HMT tumor xenografts (n=3) on day 10. (D-L) RT-qPCR analysis of different gene expression in BMT xenograft (black, n=3), AMT xenograft (green, n=3), and HMT xenograft (red, n=3) on day 10. (D)MKi-67 proliferation marker; (E–G) hypoxia related markers- HIF-1α(E), GLUT-1(F), and CA-IX(G); (H–K) cancer associated fibroblast markers- α-SMA(H), FSP(I), PDPN(J) and TGF-β(K); (L) tumor associated macrophage marker CD206; (M) Representative photographs of zebrafish BMT, AMT, and HMT xenografts (n=3) on day 14. (N–V) RT-qPCR analysis of different gene expression in these xenografts on day 14. (N–R) endothelial cell markers- VE-cadherin(N), CD31(O), VEGF-R2(P), vWF(Q), eNOS(R); (S–V) angiogenic regulators Tie2(S), TAL1(T), ETV2(U), FLI1(V). GAPDH was used as loading control for RT-qPCR analysis. All experiments were performed in triplicate (n=3).

Schematic representation of multicellular 3D tumor spheroid with distinct proliferative and necrotic zones exhibiting key features of TME such as heterogeneity, cancer cell reprogramming and stemness, aggressive phenotype, alteration of stromal cells plasticity, and tumor angiogenesis. Results obtained from the study of 3D tumor spheroids were validated in the in-vivo experiments with zebrafish tumor xenograft model and lung cancer patients tissue samples.

Acknowledgments
This image is the copyrighted work of the attributed author or publisher, and ZFIN has permission only to display this image to its users. Additional permissions should be obtained from the applicable author or publisher of the image. Full text @ Front Oncol