
- Title
-
Prostaglandin 2α Promotes Autophagy and Mitochondrial Energy Production in Fish Hepatocytes
- Authors
- Tian, J., Du, Y., Yu, E., Lei, C., Xia, Y., Jiang, P., Li, H., Zhang, K., Li, Z., Gong, W., Xie, J., Wang, G.
- Source
- Full text @ Cells

Effects of serum starvation on lipid droplet (LD) accumulation, autophagy, and mitochondrial energy production in zebrafish liver cells. Cells were incubated with either normal medium or serum-free medium for 24 h (a–g). (a) LDs were stained with BODIPY (green); nuclei were stained with DAPI (blue); and LC3A/B was stained with a specific immunofluorescent antibody (red). (b) LDs in 18 cells (6 cells in each image) were quantified using ImageJ. (c) Relative fluorescence puncta of LC3A/B per cell were quantified using ImageJ (n = 3). (d) Relative transcript expression of autophagy- and lipid catabolism-related genes (n = 3). (e) Mitochondrial copy number (n = 4). (f) ATP level (n = 6). (g) Relative transcript expression of β-oxidation- and mitochondrial respiratory chain-related genes (n = 3). (h,i) Cells were pre-treated with siRNA against negative control (NC), ATG7, or CQ and then serum-starved for 24 h. LDs were stained with BODIPY, and the TG content was measured (n = 4). atg12, autophagy-related 12; ef1α, elongation factor 1 α; lamp2, lysosomal-associated membrane protein 2; lc3b, microtubule-associated protein 1 light chain 3b; atgl, adipose tissue lipase; hsl, hormone-sensitive lipase; cpt-1, carnitine palmitoyltransferase 1; acadm, acyl-CoA dehydrogenase medium chain; acadvl, acyl-CoA dehydrogenase very long chain; acads, acyl-CoA dehydrogenase short chain; hadh, hydroxyacyl-CoA dehydrogenase trifunctional multienzyme complex; mt-nd1, NADH dehydrogenase 1, mitochondrial; sdha: succinate dehydrogenase complex, subunit A; cyc1: cytochrome c-1; mt-co1: mitochondrial cytochrome c oxidase; mt-atp: mitochondrial ATP synthase. Statistical significance is denoted with asterisks as follows: * p < 0.05; ** p < 0.01; *** p < 0.001. |
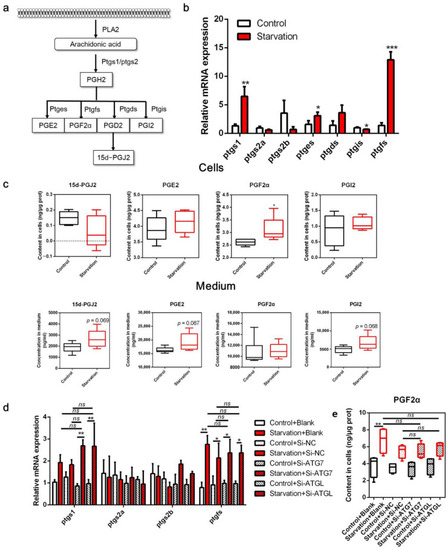
Effects of serum starvation on cyclooxygenase (COX) metabolism in zebrafish liver cells. (a) Schematic diagram of the COX pathway in arachidonic acid (ARA) metabolism. (b,c) Cells were incubated with either normal medium or serum-free medium for 24 h, and the relative transcript expression of COX metabolism-related genes (n = 3) and the concentration of ARA-derived COX metabolites in the cells and medium were measured (n = 5). (d,e) Cells were pre-treated with NC, ATG7, and ATGL siRNA and then serum-starved for 24 h, and the relative mRNA expression of COX metabolism-related genes (n = 3) and the concentration of PGF2α in cells (n = 6) were measured. Ptgs, prostaglandin-endoperoxide synthase; pgtes, prostaglandin E synthase; ptgds, prostaglandin D2 synthase; ptgis, prostaglandin I2 synthase; ptgfs, prostaglandin F synthase. Statistical significance is denoted with asterisks as follows: * p < 0.05; ** p < 0.01; *** p < 0.001; ns, not significant difference. |
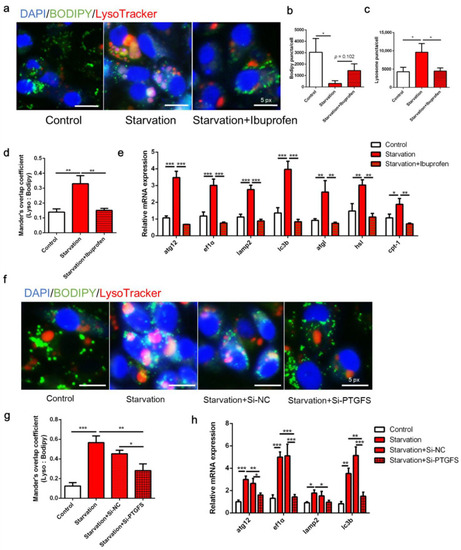
Effects of cyclooxygenase (COX) pathway inhibition on serum starvation-induced autophagy and lipid droplet (LD) degradation in zebrafish liver cells. (a–e) Cells were administered the COX inhibitor ibuprofen (10 μM) and then serum-deprived for 24 h. (f–h) Cells were pre-interfered with Si-NC or Si-PTGFS then treated with serum deprivation for 6 h. LDs were stained with BODIPY (green), nuclei were stained with DAPI (blue), and lysosomes were stained with LysoTracker (red). LD and lysosome puncta per cell as well as Mander’s overlap coefficient were measured using Image J (n = 3). Relative expression of autophagy-related genes was tested using qRT-PCR (n = 3). atg12, autophagy-related 12; ef1α, elongation factor 1α; lamp2, lysosomal-associated membrane protein 2; lc3b, microtubule-associated protein 1 light chain 3b; atgl adipose tissue lipase; hsl, hormone-sensitive lipase; cpt-1, carnitine palmitoyltransferase 1. Statistical significance is denoted with asterisks as follows: * p < 0.05; ** p < 0.01; *** p < 0.001. |
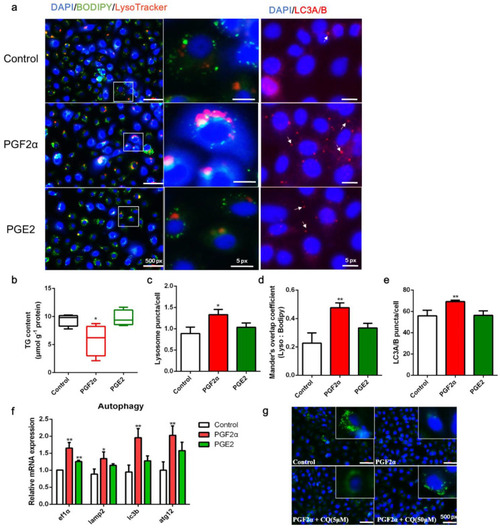
Effects of PGF2α and PGE2 on autophagy and lipid accumulation in zebrafish liver cells. Cells were incubated with or without PGF2α (10 μM) and PGE2 (10 μM) for 24 h. (a) Lipid droplets (LDs) were stained with BODIPY (green), nuclei were stained with DAPI (blue), lysosomes were stained with LysoTracker (red), and LC3A/B was stained with a specific immunofluorescent antibody (red). (b–e) Triglyceride (TG) content (n = 4), relative fluorescence of lysosome puncta (n = 3) and LC3A/B (n = 3), and Mander’s overlap coefficient of lysosome/BODIPY (n = 3) in each image were quantified using ImageJ software (n = 4). (f) Relative transcript expression of autophagy-related genes (n = 3). (g) Cells were pre-incubated with autophagy inhibitor CQ, then treated with PGF2α for 24 h; the LDs and nuclei were stained with BODIPY and DAPI, respectively. ATG12, autophagy-related 12; EF1α, elongation factor 1 α; LAMP2, lysosomal-associated membrane protein 2; LC3b, microtubule-associated protein 1 light chain 3b. Statistical significance is denoted with asterisks as follows: * p < 0.05; ** p < 0.01. |
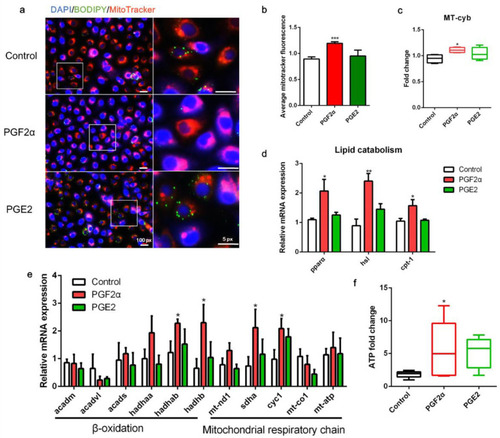
Effects of PGF2α and PGE2 on mitochondrial function in zebrafish liver cells. Cells were incubated with or without PGF2α (10 μM) and PGE2 (10 μM) for 24 h. (a) Lipid droplets were stained with BODIPY (green), nuclei were stained with DAPI (blue), and mitochondria were stained with MitoTracker (red). (b) Average MitoTracker fluorescence per cell (n = 3). (c) Mitochondrial copy number (n = 4). (d) Relative transcript expression of lipid catabolism-related genes (n = 3). (e) Relative transcript expression of β-oxidation- and mitochondrial respiratory chain-related genes (n = 3). (f) ATP levels (n = 6). Statistical significance is denoted with asterisks as follows: * p < 0.05; ** p < 0.01; *** p < 0.001. |
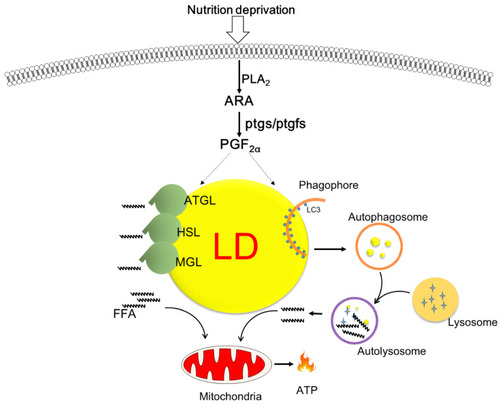
Schematic overview of the proposed role of cyclooxygenase-mediated lipid droplet degradation in response to nutrition deprivation in zebrafish hepatocytes. Serum starvation triggers the release of arachidonic acid and augments the production of PGF2α, which is a key molecule promoting lipid mobilization via autophagy/lipophagy and lipolysis as well as mitochondrial energy production. |