
- Title
-
The cation exchanger Letm1, circadian rhythms, and NAD(H) levels interconnect in diurnal zebrafish
- Authors
- Dao, P., Hajny, S., Mekis, R., Orel, L., Dinhopl, N., Tessmar-Raible, K., Nowikovsky, K.
- Source
- Full text @ Life Sci Alliance

The highly conserved gene letm1 is broadly expressed in zebrafish with high levels in brain. (A) Phylogenetic analysis of Letm1/2 family proteins using the free online access tools phylogeny.fr and itol.embl.de/. HCCR1 was used as an out-group. (B, C, D) Confocal images of HeLa cells expressing CMV-Drletm1-eGFP (green) and stained with MitoTracker Red (magenta). Scale bar 10 μm. (E) Relative mRNA levels of letm1 in zebrafish larvae, head, and tail at 3 and 7 day post fertilization (dpf), normalized to the eukaryotic elongation factor-1 α (eef1a). Each data point represents a biological replicate. 3 dpf head (n = 12); 3 dpf tail (n = 9); 7 dpf head (n = 14); 7 dpf tail (n = 9). t test: ****P ≤ 0.0001. (F) Relative mRNA levels of letm1 in adult organs (SB, swimming bladder), normalized to eef1a. Each data point represents a biological replicate. Mean ± SEM. (G, H) In situ hybridization of letm1 on wild-type embryos at 1 dpf. Scale bar 1 mm. (I) Schematic representation of the adult zebrafish brain in lateral view. Blue vertical lines represent the location of the brain in lateral view. Blue vertical lines represent the location of the brain slices displayed. OB, olfactory bulb; Tel, telencephalon; TeO, optic tectum; Ce, corpus cerebelli; HT, hypothalamus; IL, inferior lobe; MO, medulla oblongata. (J, K, L) In situ hybridization of letm1 on coronal slices of wild-type adult brain. (J’, K’, L’) Magnification of the left panel. (M, N, O) Sense control. Scale bars 500 μm. |

Letm1 localizes exclusively in mitochondria and displays a diel rhythm. (A) Schematic representations of letm1 gene and protein below with the locus (yellow box) of the deletion induced by the TALEN pairs. The region deleted (Δ16) is represented in “–.” The red asterisk represents a stop codon. TM, transmembrane region. 14-3-3, also known under the name of LETM Domain or LETM1 RBD (ribosomal binding domain) CC, coil–coil; EF, putative Ca2+-binding EF hand motif. Green bar indicates the protein fragment used to generate the Dre-Letm1 antibody. (B) Immunoblot using 6 day post fertilization zebrafish protein lysates from WT and letm1−/− with β-actin as a loading control. (C, D, E, F, G, H) Confocal images of WT and letm1−/− zebrafish cells immunolabeled with zebrafish anti-Letm1 (green) and stained with MitoTracker Red (magenta) and DAPI (blue). Scale bar 10 μm. (I) Representative immunoblots using 6 and 7 day post fertilization zebrafish protein lysates from WT and letm1−/− fish probed with anti-Letm1, anti-Tom20 and anti–β-actin. (J) Quantitative graph of four biological replicates (see Fig S1A–D) representing the relative protein level of Letm1 to β-actin over circadian time points. One-way ANOVA, n = 4. |
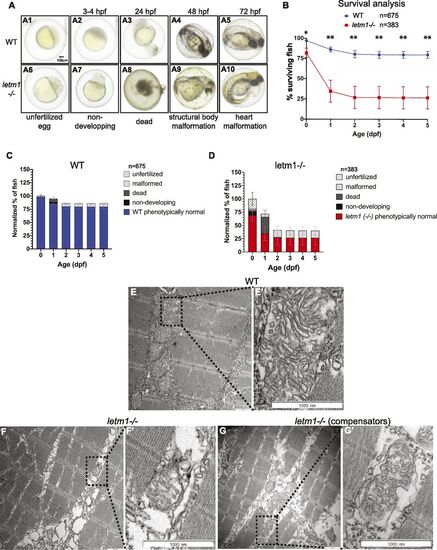
letm1 KO impacts embryonic development, survival and mitochondrial morphology. (A) Images of WT and letm1−/− zebrafish embryos. Lower panel display representative images of the different categories used in the phenotypic analysis. (A1–A5) Representative images of wild-type, phenotypically normal fish. (A6–A10) Representative images of letm1−/−, (A6) unfertilized egg, (A7) non-developing, (A8) dead, (A9) structural body malformation, and (A10) heart malformation. Scale bar: 100 μm. (B) Survival analysis of zebrafish wild-type (WT) and letm1−/− from 0 to 5 day post fertilization (dpf). Quantification of the number of surviving fish per day shown in percentage. The total number of fish analyzed was nWT = 675 and nletm1−/− = 363. Graph shows mean ± SEM. Welch t test, *P < 0.05. (C, D) Phenotypic analysis of zebrafish WT (C) and letm1−/− (D) from 0 to 5 dpf. (E, F, G) Transmission electron microscopy images of 4 dpf zebrafish larvae: WT (E) Longitudinal section of muscle fibers show dense mitochondrial; malformed letm1−/− (F) have less cristae in intramyofibrillar mitochondria, arrow points to detached outer membrane, asterisk to a vacuole-like shape, possibly indicating the transition between damaged, and degraded mitochondria; letm1−/− compensators, with denser mitochondria than in non-compensator letm1−/− and apparently not fusing with vacuoles (G). Scale bar 1,000 nm. (E’, F’, G’) Magnification of the boxed dotted line area. |

Evolutionary tree of Nampt, measurement of NAD+/H levels, and expression of nampt and clock genes. (A) Phylogenetic analysis of Nampt protein. (B) Measurement of NAD+ and NADH in 1 day post fertilization (dpf) zebrafish embryos WT and letm1−/−. Each data point represents a biological replicate, each biological replicate contained 20 embryos. N(WT) = 6 and n(letm1−/−) = 7 biological replicates, NAD+ P = 0.0789, NADH *P < 0.05, Holm multiple comparison. (C, D) Relative mRNA levels across circadian time points of nampt1 and nampt2 in 6 dpf zebrafish larvae WT (blue) and letm1−/− (red). The expression is normalized to β-actin. Each data point represents a biological replicate, n = 6 biological replicates. One-way ANOVA with Tukey’s multiple comparisons test: ****P < 0.0001. (E, F, G) Relative mRNA levels of clock1a (E), period1b (per1b) (F), and period2 (per2) (G) normalized to β-actin in 6 dpf larvae. Each data point represents a biological replicate, n = 6. One-way ANOVA with Tukey’s multiple comparisons test: *P < 0.05; ***P < 0.001 ****P < 0.0001. (H) Schematic summarizing the NAD+ production pathways in the cell, adapted from Verdin (2015). (I) Schematic of a proposed model linking the effect seen on the circadian clock, based on Sassone-Corsi (2012) and Levine et al (2020). |

Comparison of letm1+/+ and letm1−/− compensators versus non-compensators. (A, B, C, D) Representative images of zebrafish larvae at 4 day post fertilization, wild type (WT) (A), letm1−/− compensators (C) (B), and letm1−/− non-compensators (NC) (C, D), sampled for RNA sequencing. Scale bar = 1 mm. (E, F, G) Gene set enrichment analysis grouped in clusters according to gene ontology terms. (E, F, G) Up-regulated clusters (orange) and down-regulated clusters (blue) are shown for each pairwise comparison C versus NC (E), C versus WT (F), and NC versus WT (G). The threshold was set to P (adjusted) value = 0.05 and log2 fold change = ±1. (H) Schematic showing the kynurenine pathway and Preiss–Handler and salvage pathways for NAD production, where certain enzymes are down-regulated in NC and C. NC: letm1−/− non-compensators and C: letm1−/− compensators. Dashed lines indicate intermediate metabolic steps. (I) Heat map of expression of enzymes involved in the different pathways of NAD production in pairwise comparisons C versus NC, C versus WT, and NC versus WT. Stars indicate the significance of the adjusted P-value obtained with the Benjamini–Hochberg method (*P-value < 0.05; **P-value < 0.01; ***P-value < 0.001). |

Letm1 has a diel rhythm peaking at ZT23. (A, B, C, D) Immunoblots using 6 and 7 day post fertilization zebrafish protein lysates from WT and letm1−/− fish probed with antibodies against Letm1, Tom20, and β-actin, using additional biological replicates (BR). Immunoblots in (A) were displayed in the main Fig 2I, as representative blots. The obvious irregularity in single and double bands and unstable protein levels of Tom20 disqualified it for protein normalization, though densitometry analysis of Tom20 relatively to β-actin did not indicate significant changes. |
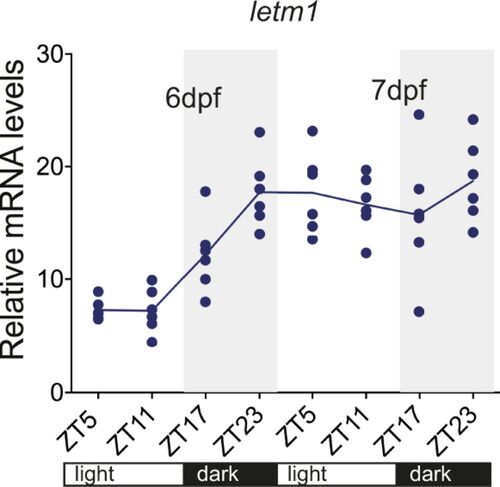
letm1 mRNA levels do not display a diel rhythm. Relative mRNA levels of letm1 in 6 and 7 day post fertilization larvae normalized to β-actin. Each data point represents a biological replicate, n = 6. One-way ANOVA with Tukey’s multiple comparisons test. |

Analyses of bmal1 and letm2 mRNA in letm1+/+ versus letm1−/− compensators. (A, B) Relative mRNA levels of bmal1a (A) and letm2 (B) in 6 day post fertilization larvae normalized to β-actin. Each data point represents a biological replicate, n = 6. One-way ANOVA with Tukey’s multiple comparisons test. |

RNA-sequencing reveals differential expression of several solute carriers and mitochondrial solute carriers. (A) Heat map of expression in C versus NC, NC versus WT, and C versus WT, of solute carriers in plasma membrane. “td” = tandem duplicate. Family 1 = amino acid transporters; Family 2 = glucose transporters; Family 3 = heteromeric amino acid transporters; Family 4 = bicarbonate transporters; Family 5 = Na+-dependent glucose transporters; Family 6 = neurotransmitters transporters; Family 7 = heteromeric aa transporters; Family 8 = sodium/calcium transporters; Family 9 = sodium/hydrogen transporters; Family 10 = sodium bile acid transporters; Family 11 = proton coupled chloride transporters; Family 12 = cation coupled chloride transporters; Family 13 = sodium-dependent dicarboxylate transporter; Family 15 = proton oligopeptide transporters; Family 16 = monocarboxylate transporter; Family 17 = phosphate and organic transporters; Family 20 = sodium-dependent phosphate transporters; Family 22 = organic and anion transporters; Family 23 = ascorbic acid transporters; Family 24 = sodium/potassium/calcium transporters; Family 26 = anion exchangers; Family 27 = fatty acid transporters; Family 29 = nucleoside transporters; Family 30 = zinc transporters; Family 32 = GABA of glycine vesicle transporters; Family 34 = sodium phosphate; Family 35 = nucleotide sugar; Family 37 = phosphosugar/phosphate exchangers; Family 38 = sodium-dependent neutral amino acid; Family 39 = metal ion transporters; Family 41 = divalent cation transporters; Family 43 = large neutral amino acid transporters; Family 45 = putative sugar transporters; Family 47 = multidrug and toxin extrusion transporters; Family 48 = heme transporter; Family 49 = FLVCR-related heme transporters; Family 50 = sugar transporters; Family 66 = lysosomal amino acid transporters. (B) Heat map of expression in C versus NC, NC versus WT and C versus WT, of mitochondrial solute carriers (SLC family 25). “Solute carrier family 8 member 1b” = Na+/Ca2+ exchanger; “Solute carrier family 25 member 13” = aspartate-glutamate carrier; “Solute carrier family 25 member 15a” = ornithine transporter role in urea cycle; “Solute carrier family 25 member 22a” = malate-aspartate shuttle, glutamate transporter; “Solute carrier family 25 member 38a” = mitochondrial glycine transporter functions in heme biosynthesis, orthologue of APOPTOSIN.” Solute carrier family 25 member 55a” = letmd1. |

Immune response genes are upregulated in letm1−/− non-compensators. (A, B) Heat map of expression in C versus NC, NC versus WT, and C versus WT, of a subset of genes related to the immune response, major down-regulated node in the enrichment analysis of the pairwise comparison C versus NC. |

Biosynthesis and extracellular collagen formation differential expression. (A, B) Heat map of expression in C versus NC, NC versus WT, and C versus WT, of the “biosynthesis” and “extracellular collagen formation” clusters. |