FIGURE SUMMARY
Title

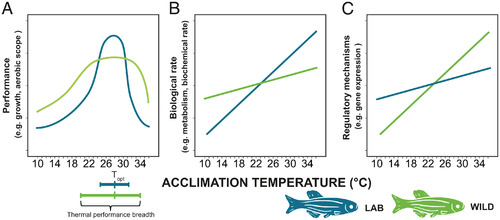
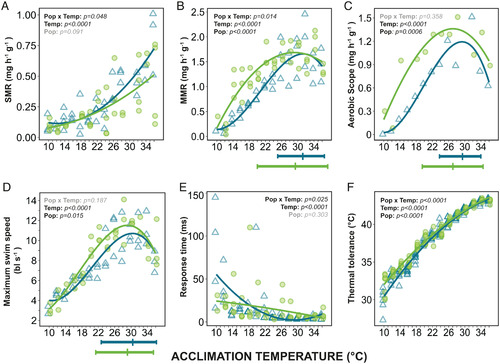
Reduced physiological plasticity in a fish adapted to stable temperatures

Authors
Morgan, R., Andreassen, A.H., Åsheim, E.R., Finnøen, M.H., Dresler, G., Brembu, T., Loh, A., Miest, J.J., Jutfelt, F.
Source
Full text @ Proc. Natl. Acad. Sci. USA

Predictions of how reduced physiological plasticity can be detected: (A) We predict that laboratory zebrafish (blue) will show higher performance in the measured traits at the optimal temperature (Topt) but have a narrower thermal performance breadth (≥80% performance) than wild zebrafish (light green). (B) We predict that wild zebrafish will show a higher capacity for adjusting their biochemistry and physiology (through acclimation or physiological plasticity) to counteract direct thermal effects on biological rates. This will be evident in wild zebrafish maintaining close to normal biological rates (i.e., metabolism) across different temperatures, post acclimation, while laboratory zebrafish will display more extreme rates as temperatures increase or decrease. (C) To allow a consistent performance after acclimation, we predict greater regulation in the underlying mechanisms in the wild zebrafish compared to the laboratory zebrafish.

Thermal performance curves of wild and laboratory zebrafish for metabolic rates and other physiological traits after acclimation to temperatures from 10 °C to 36 °C. (A) Standard metabolic rate (SMR), each point represents an individual fish. (B) Maximum metabolic rate (MMR), each point represents a group of six fish (measured together). (C) Aerobic scope, the difference between mean MMR and mean SMR. (D) Maximum swim speed (body lengths sec−1) where each point represents a group of six fish. (E) Response time (latency to respond to a stimulus), each point represents the median response time of an individual fish. (F) Thermal tolerance (using the critical thermal maxima method: CTmax) of individual fish. Optimal temperatures for performance and thermal performance breadths (80% performance) are illustrated beneath (BD) and exact values as shown in SI Appendix, Table S7. The P values for the statistical models are indicated on each panel: Temp, effect of temperature on trait; Pop, difference between wild (light green circles) and laboratory (blue triangles) fish (intercept at 23 °C); and Pop × Temp, interaction (see SI Appendix, Tables S1 and S2).

Comparison of gene expression in wild and laboratory zebrafish acclimated to temperatures from 10 °C to 36 °C. Heat shock protein (hsp) expression (A–F): hsp70 and hsp90 in the muscle (A and D), liver (B and E), and brain (C and F). Statistical model results indicated on each panel: Temp, effect of temperature on expression; Pop, difference between wild (light green circles) and laboratory (blue triangles) fish (at 23 °C); Pop × Temp, interaction. (G) Heatmap showing the difference in muscle gene expression (log transformed) between wild and laboratory zebrafish. Genes are grouped by functional groups and colors represent relative expression within these groups where green shows a higher expression in wild fish and blue a higher expression in laboratory fish. White illustrates no difference. Grey illustrates not analyzed. Full gene names and functions can be found in SI Appendix, Table S3.

Growth, behavior, survival, and cell size in wild (green circles) and laboratory (blue triangles) zebrafish acclimated from 10 °C to 36 °C. Growth rate (A–C): (A) specific growth rate for weight for each individual fish; (B) relative quantity of growth hormone receptor α (ghra) in muscle tissue; and (C) relative quantity of insulin-like growth factor 1 (igf) in muscle tissue. Behavioral (D–F): (D) swimming activity (body lengths [bl] moved per minute) for individual fish prealarm cue; (E) change in activity in response to an alarm cue; and (F) change in time bottom-dwelling (sec min−1) in response to alarm cue, compared with prealarm cue. Survival (G): percentage survival of wild and laboratory fish after 35 d of acclimation to temperatures from 10 to 38 °C. (H) Red blood cell size (FSC-A). (I) RNA:DNA ratio (proxy of current growth). Maximum performance and upper and lower thermal performance breadths (80% performance) are illustrated beneath (A). Statistically significant differences indicated on each panel: Temp, significant effect of temperature on trait; Pop, significant difference between wild and laboratory fish (at 23 °C); Pop × Temp, significant interaction (see SI Appendix, Tables S1, S2, and S5).

Acknowledgments
This image is the copyrighted work of the attributed author or publisher, and ZFIN has permission only to display this image to its users. Additional permissions should be obtained from the applicable author or publisher of the image. Full text @ Proc. Natl. Acad. Sci. USA