
- Title
-
Peripheral NOD-like receptor deficient inflammatory macrophages trigger neutrophil infiltration into the brain disrupting daytime locomotion
- Authors
- Kwon, V., Cai, P., Dixon, C.T., Hamlin, V., Spencer, C.G., Rojas, A.M., Hamilton, M., Shiau, C.E.
- Source
- Full text @ Commun Biol
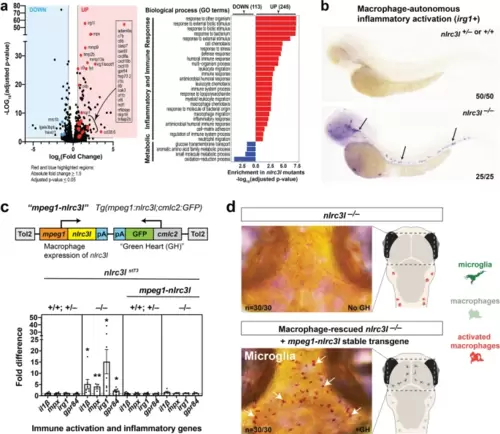
a RNA-seq analysis comparing nlrc3l mutants over heterozygous and wild-type siblings at the 4-dpf larval stage show significant upregulation of inflammatory and immune response genes, and downregulation of metabolic and microglia genes in whole larvae. b Whole mount in situ hybridization of macrophage activation marker irg1/acod1 mRNAs in the 2.5 dpf zebrafish larvae show specific and robust induction of irg1 expression in nlrc3l mutants but no expression in wild-type or heterozygous siblings. c Top, schematic of the macrophage rescue construct used to generate the stable mpeg1-nlrc3l transgenic line to restore wild-type macrophages in nlrc3l mutants using the Tol2 transposon system. Bottom, qPCR analysis demonstrates efficacy of the stable macrophage rescue transgene to reverse increased expressions of pro-inflammatory and neutrophil genes in nlrc3l mutants, thereby abrogating systemic inflammation. Dotted line marks no change relative to control siblings at a fold difference of 1. Error bars show sem; **p-value < 0.01; *p < 0.05. qPCR was conducted using three technical replicates and a minimum of three biological replicates. Fold difference is determined relative to average sibling level either with or without the macrophage rescue construct. d Characterization of macrophage-rescued nlrc3l mutants demonstrates restoration of microglia in all mutants analyzed carrying the mpeg1-nlrc3l transgene (+GH) but not in mutants without the macrophage rescue construct (no GH). Left, neutral red staining marks microglial cells in red (arrows). Right, cartoons showing status of microglia and peripheral macrophages; dotted box shows region depicted in the neutral red images on the left. |
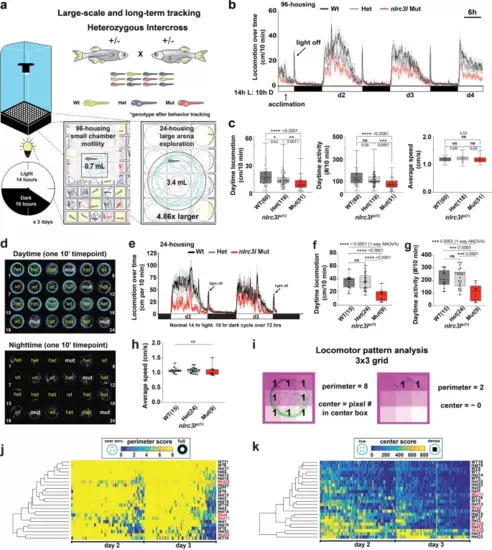
a Schematic of the automated behavior tracking system for 96-well and 24-well chambers. Mutants are derived from heterozygous intercrosses and all animals are randomized and individually placed in each well without prior knowledge of their genotypes. See recording of animals in 96-well (Supplementary Movie 1) and in 24-well (Supplementary Movie 2) housings. b Representative time plot of locomotor tracking in 96-well chamber. 14-h light cycle and 10-h dark cycle (14 h L: 10 h D) was applied. Light turns on at 7 am and turns off at 9 pm each day, and the “light off” event triggers the expected hyper visuomotor response (sudden rapid increase in swimming activity, arrow). nlrc3l mutants (red graph) consistently show a significant average decrease in spontaneous swimming. c Calculations of different daytime locomotor metrics from three independent behavior tracking sessions. One of these sessions is represented in time plot in b. d Representative swimming traces of a day and a night timepoint from 24-well tracking. Genotypes were determined after completion of experiment and added back to the traces. Traces show typical inter-individual variation not readily associated with any genotype. Activity is highly suppressed at night. Teal traces mark large movements (≥0.5 cm/s) and magenta traces mark small movement (<0.5 cm/s). e–h Behavior tracking using the large-arena 24-well platform and associated quantifications from two independent behavior tracking sessions. See associated Supplementary Movie 3. i Diagram illustrating locomotor pattern analysis based on a 3 × 3 grid system. Traces of swimming trajectories were recorded at every 10-minute interval over the entire 72-hour tracking. Traces corresponding to d2 and d3 timepoints were scored. See Methods for details on the calculations. j, k Heatmaps combined with hierarchical clustering of perimeter and center scores do not show any segregation of fish based on genotype, indicating similar patterns of locomotion between nlrc3l mutants and their siblings. c, e–h Number in parenthesis is n, number of individual animals analyzed. Scatter box-and-whisker plots show minimum and maximum; each data point represents an individual animal. Daytime locomotion is measured by the total swimming distance per 10-min interval. Daytime activity is number of bouts of swimming detected per 10-min interval. All metrics were averaged over d2 and d3 timepoints per fish. d2, 14-h light period on day 2; d3, 14-h light period on day 3; d4, partial light period on day 4. Scale bar, 6 h (hours). ns, not significant; *p < 0.05; **p < 0.01; ***p < 0.001; ****p < 0.0001; all p-values are FDR-adjusted. Statistical significance was calculated using multiple comparisons test after one-way ANOVA test, or the Brown-Forsythe and Welch ANOVA test for groups with unequal standard deviations. |
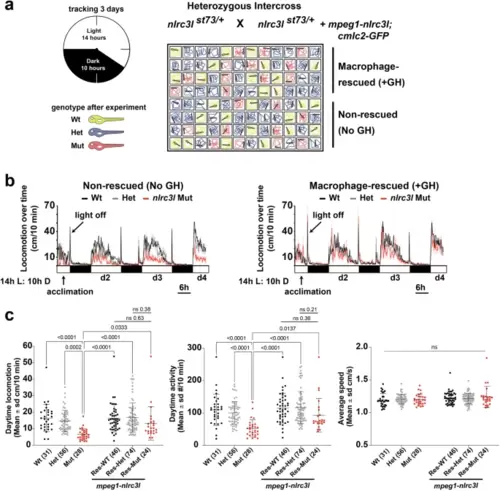
a Schematic of experimental setup to analyze locomotor behaviors of macrophage-rescued (+GH) and non-transgenic non-rescued (No GH) sibling zebrafish side by side. b Time plots showing the efficacy of the stable mpeg1-nlrc3l transgene to largely restore daytime locomotion in nlrc3l mutants from their reduced baseline level (shown in the non-rescued plot). The rescue transgene had no apparent effect on the heterozygous and wild-type siblings; no difference in locomotor behavior was found between siblings with and without the rescue transgene. c Scatter box-and-whisker plots showing no significant difference in daytime locomotion or activity in macrophage-rescued nlrc3l mutants compared with baseline wild-type siblings, while baseline nlrc3l mutants showed a significant reduction. n number of animals analyzed shown in parenthesis below each scatter plot. Three independent experiments were conducted to compare larvae derived from an nlrc3l heterozygous intercross with and without the macrophage rescue transgene on the same plate. Statistical significance was determined by two-way ANOVA test followed by multiple comparison tests. FDR-adjusted p-values are reported; ns, not significant as defined by p-values > 0.05. All pairwise brackets not shown are ns, not significant. Res, individuals carrying the rescue transgene. |
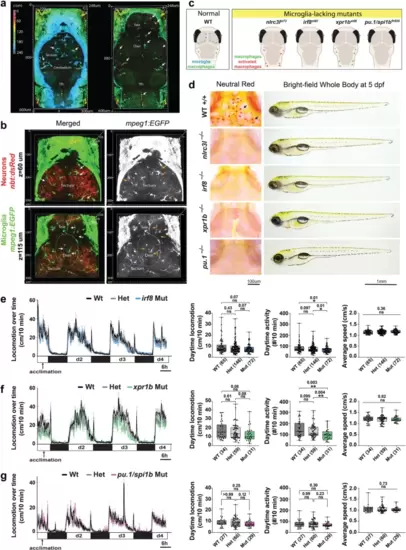
a Volumetric views of wild-type 5 dpf larval brain showing microglia (arrows) using the mpeg1:GFP transgene as cells depth-coded from most ventral in magenta to most dorsal in cyan. See corresponding z-stack data in Supplementary Movie 4. Left, dorsal surface at z = 220 μm shows the tectum, cerebellum, and hindbrain (hb). Right, more ventral view at z = 160 μm shows the telencephalon (tele) and diencephalon (dien). b Volumetric views of a z-stack from two axial levels (z = 60 μm and 115 μm) of a wild-type double transgenic zebrafish at 5 dpf showing microglia (GFP+) intimately intermingled with neurons (dsRed+) throughout the larval brain. See corresponding z-stack data in Supplementary Movie 5. c Diagram depicting microglia and peripheral macrophage status in wild-type and four distinct microglia-lacking mutants in larval zebrafish. d Characterization of the four mutants (nlrc3l−/−, irf8−/−, xpr1b−/− and pu.1/spi1b−/−) by neutral red staining shows an absence of microglia, and by bright-field transmitted microscopy shows normal gross morphology with large swim bladders indistinguishable from wild-type. Locomotor behavior tracking in the 96-well platform analyzing irf8 mutants (e), xpr1b mutants (f), and pu.1/spi1b mutants (g). One-way ANOVA tests followed by multiple comparisons were used to determine statistical significance; individual p-values shown; locomotion from d2-d4 was analyzed; ns, not significant. See also associated Supplementary Movies 4 and 5. |
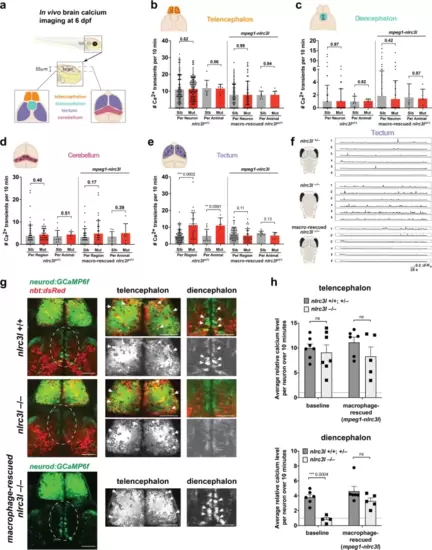
a Schematic showing the brain regions captured by calcium imaging. Two z-planes in the 6 dpf larval brain were imaged using the genetically encoded calcium indicator neurod:GCaMP6f. b–e Scatter bar charts show the number of spontaneous calcium transients in the corresponding brain regions as illustrated for baseline and after macrophage-rescue. Cerebellum and tectum were each divided into six regions for analysis as depicted in each cartoon. As indicated, calcium transients were calculated on an individual neuron or region basis, or per animal basis using the average calcium transient number of the neurons or region of analysis. The only significant difference found in nlrc3l mutants compared with control siblings was an increase in tectal neuronal calcium transients, which was reversed after macrophage rescue. f Traces from representative individuals of each genotype showing calcium activity (GCaMP6f+) from each of the six tectal regions (1–6) analyzed. Plots show an apparent increase in spiking events in the nlrc3l mutant at baseline. g Relative intracellular calcium levels in the telencephalon and diencephalon (dotted region) at baseline were determined. nlrc3l mutants had consistently lower intracellular calcium in diencephalic neurons corresponding to the dorsal thalamus compared with control siblings, but this was reversible by the macrophage rescue. Arrows point to neurons with robust somatic calcium levels (high GCaMP6f+). h Bar charts show relative intracellular calcium levels in the telencephalon and the diencephalon as an average over the neurons analyzed for each respective region. Each data point represents an individual animal. No difference was determined in intracellular calcium level in the telencephalic neurons based on genotype, but diencephalic neurons were found to have significantly lower intracellular calcium in nlrc3l mutants compared with control siblings. ns, not significant. Two-tailed t-test was used to determine statistical significance. See also associated Supplementary Fig. 8 and Supplementary Movies 6 and 7. |

a Bar chart conveys qPCR analysis of dopaminergic system genes (th, th2, and dat), indicating a significant decrease in th mRNA expression in nlrc3l mutants. b Anti-TH immunostaining characterization of the pretectal dopaminergic neurons (red arrows) at 6 dpf shows no apparent difference between nlrc3l mutant and control wild-type. c Quantification of the relative TH protein level and relative area of TH + staining. d–f Characterization of the ventral larval brain at 6 dpf shows a large significant reduction in TH protein level in the posterior tuberculum of the DDC, and a modest and nearly significant decrease in the noradrenergic locus coeruleus (LC). Right, quantifications of the relative TH protein level and relative area of TH + staining in the DDC and LC. c, e, f Area was determined relative to the average (avg) area size of wild-type and heterozygous siblings (sib). Two-tailed t-test was used to determine statistical significance. Error bars show standard error of mean for relative TH staining and standard deviation for relative area. |

a Schematic showing brain region and categories of neutrophils analyzed in 5–6 dpf larvae from nlrc3l heterozygous intercross with (+GH) and without (no GH) the macrophage rescue transgene (mpeg1-nlrc3l). Lingering (blue arrow) defines infiltrated neutrophils that remain in the brain over the entire 15-min period of imaging, while circulating (red dotted circle) defines neutrophils observed only at a single timepoint (imaged every 30-s) that flow through the brain. GH, GFP + heart. b Representative 3D volumetric images of neutrophils (lyz:GFP+) in the brain at baseline and after macrophage rescue. See associated Supplementary Movies 9, 10, 12, and 13 showing the same zebrafish larvae as shown here. c Scatter bar plots show quantifications of brain lingering and circulating neutrophils, and total neutrophil numbers in the head periphery. Macrophage rescue reversed neutrophil infiltration in the nlrc3l larval brain, but not an overall increase in neutrophil numbers. Error bars show standard error of mean. Significance was determined by two-tailed t-tests. d Still images extracted from time-lapse confocal imaging showing circulating and infiltrating neutrophils in the brain at embryonic stage of 2 dpf and larval stage of 6 dpf (see associated Supplementary Movies 6 and 7). Individual neutrophils lingering in the parenchyma are labeled by arrows in different colors over three timepoints. Dotted circles mark circulating neutrophils passing through. tele telenchephalon, dien diencephalon, cp chorid plexus, max proj maximum projection of a z-stack. e Genetic ablation of neutrophils using combined morpholinos against csf3r and spi1b and single morpholino against csf3r (top diagram). Uninjected and control morpholino injected groups show the expected reduced daytime locomotion in nlrc3l mutants. By contrast, daytime locomotion was significantly improved in nlrc3l mutants after neutrophil ablation using both morpholino strategies. No effect on locomotion was found in wild-type and heterozygous siblings after morpholino-mediated neutrophil ablation compared with baseline controls. Scatter plots show mean ± standard deviation from data of individual animals. Two-tailed t-tests were used to determine statistical significance. n number of animals analyzed shown below each bar graph. See also associated Supplementary Movies 8–13. |
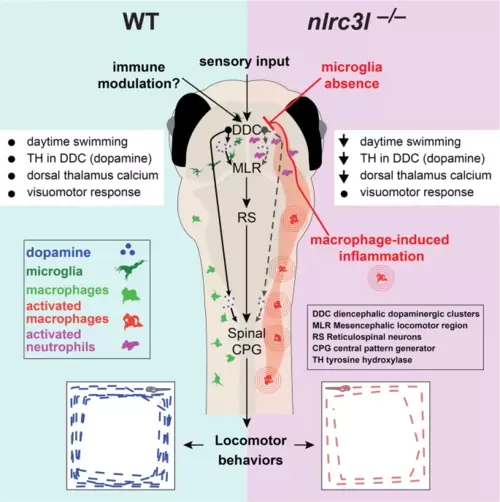
Comparison between wild-type and nlrc3l mutant zebrafish conveys our current model. Sensory transduction based on a visuomotor response remains intact in nlrc3l mutants, while we show that immunomodulation is an important factor regulating larval zebrafish locomotion at steady state. The overall results suggest an inhibitory effect from macrophage-induced inflammation compounded by microglia loss on dopamine neurotransmission and subsequent activation of the descending neural circuits executing daytime locomotion. The neural circuits underlying locomotor drive may constitute diencephalic dopaminergic clusters (DDC) that either directly activate the spinal circuits (that include the central pattern generator (CPG)), or indirectly activate the mesencephalic locomotor region (MLR) and reticulospinal neurons (RS) to execute or potentiate swimming. Macrophage-induced inflammation activates neutrophils to infiltrate several regions of the brain, most notably in the vicinity of the diencephalic dopaminergic neurons where they may locally modulate neural circuits that control locomotor drive. List of effects: black dot indicates normal/typical status, and downward arrow means a reduction. Reversal of the locomotor deficit in nlrc3l mutants by restoring wild-type macrophages indicates that the behavioral phenotype is driven by mutant inflammatory macrophages. Further optogenetic or chemogenetic manipulations of the proposed neural circuit are needed to validate the working model. |