
- Title
-
Agonists of prostaglandin E2 receptors as potential first in class treatment for nephronophthisis and related ciliopathies
- Authors
- Garcia, H., Serafin, A.S., Silbermann, F., Porée, E., Viau, A., Mahaut, C., Billot, K., Birgy, É., Garfa-Traore, M., Roy, S., Ceccarelli, S., Mehraz, M., Rodriguez, P.C., Deleglise, B., Furio, L., Jabot-Hanin, F., Cagnard, N., Del Nery, E., Fila, M., Sin-Monnot, S., Antignac, C., Lyonnet, S., Krug, P., Salomon, R., Annereau, J.P., Benmerah, A., Delous, M., Briseño-Roa, L., Saunier, S.
- Source
- Full text @ Proc. Natl. Acad. Sci. USA

Drug screen in NPHP1 urine-derived renal epithelial cells (URECs). (A) Representative images of immunofluorescence of primary cilia (ARL13B, green), basal bodies (γ-Tubulin, red), and nuclei (DAPI, blue) in URECs derived from NPHP1 patients (NPHP1), control individuals (CTL), and CKD patients 5 d after seeding. (Scale bar, 10 µM.) (B) Quantification of ciliogenesis in NPHP1 (n = 11), CTL (n = 6), and CKD (n = 5) URECs expressed as the mean for all individuals and shown using a box-and-whisker plot. n = 1 to 15 experiments (mean of 3.5 experiments per cell line). Mixed linear-regression model with quasibinomial penalization taking into account the correlation of observations coming from the same individuals using a random effect on the cell line: ***P < 0.001, ****P < 0.0001, ns: not significant. (C, Left) NPHP1 URECs (Pt1) were treated for 2 d with the 11 selected compounds from the primary screen and ciliogenesis was evaluated 5 d after seeding. (Right) Quantification of ciliogenesis. A: ALP, 200 nM; B: Cyproheptadine, 1 µM; C: Ethopropazine, 50 nM; D: Fluticasone, 10 nM; E: Methotrexate, 400 nM; F: Mycophenolic acid, 200 nM; G: Paclitaxel, 100 pM; H: Pyrimethamine, 500 nM; I: Simvastatin, 10 nM; J: Tropisetron, 2 µM; K: Verapamil, 80 nM. Mean ± SEM n = 1 to 2 experiments. |
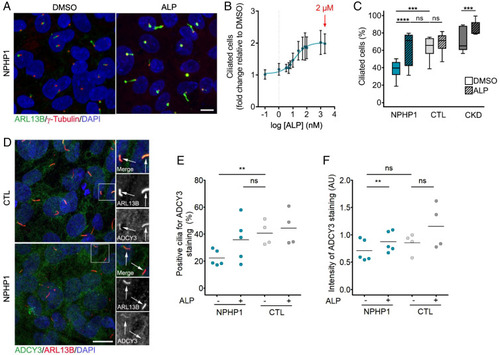
Validation of prostaglandin signaling as a target in NPHP1-defective renal cells. (A) Representative images of immunofluorescence of primary cilia (ARL13B, green), basal bodies (γ-Tubulin, red), and nuclei (DAPI, blue) in NPHP1 URECs 5 d after seeding treated for 2 d with DMSO (0.04%) or ALP (2 µM). (Scale bars, 10 µM.) (B) Quantification of ciliogenesis in one NPHP1 UREC (Pt1) exposed for 2 d to increasing concentrations of ALP. Mean ± SEM n = 2 to 4 experiments. Nonlinear regression. (C) Quantification of ciliogenesis in URECs derived from NPHP1 patients (NPHP1, n = 11), CTL individuals (n = 6), and CKD patients (n = 5) exposed for 2 d to DMSO (0.04%) and ALP (2 µM). Results are expressed as the mean for all individual categories and are shown using a box-and-whisker plot. n = 1 to 15 experiments per cell line (mean of 3.5 experiments per cell line). Mixed linear-regression model with quasibinomial penalization taking into account the correlation of observations coming from the same individuals using a random effect on the cell line: ***P < 0.001, ****P < 0.0001, ns: not significant. (D) Representative images of immunofluorescence of ADCY3 (green), primary cilia (ARL13B, red), and nuclei (DAPI, blue) in NPHP1 and CTL URECs. Arrows indicate ARL13B+ cilia. (Scale bars, 10 µM.) (E and F) Quantification of the percentage of ADCY3+ cilia (E) and of the intensity of ADCY3 in those cilia (F) in NPHP1 (n = 5) and CTL (n = 4) URECs 5 d after seeding treated for 2 d with DMSO (0.04%) or ALP (2 µM). Each dot represents one individual cell line. Bars indicate mean. n = 3 experiments. Mixed linear-regression model with quasibinomial penalization (E), Mann–Whitney U test (NPHP1 vs. CTL) and paired Student’s t test (DMSO vs. ALP) (F): **P < 0.01, ns: not significant. AU: arbitrary unit. |

In vivo validation of the effect of ALP treatment on Nphp1−/− kidney. (A) Representative images of PAS staining of kidney sections from 5-mo-old Nphp1+/+ and Nphp1−/− mice treated daily with vehicle (PBS) or ALP (80 µg/kg) from month 1 to month 5. (Scale bar, 50 µm.) An asterisk signifies tubular dilatations. (B) Dilatation index for 5-mo-old Nphp1+/+ and Nphp1−/− mice upon ALP treatment. (Upper) Dilatation index for the number of dilatation/10 µm2 (cortex). (Lower) Total area covered by dilatations/cortex area. n = 9 to 10 male mice for each genotype/treatment. χ2 test: *P < 0.05. (C) Representative images of immunostaining of 5-mo-old Nphp1+/+ and Nphp1−/− kidney sections upon ALP treatment with anti-Calbindin (CNT, green), anti-ARL13B (cilia, red), anti-Barttin (TAL, DCT, and CNT, gray) antibodies, and DAPI (nuclei, blue). (Scale bar, 5 µm.) (D) Quantification of cilium length in CNT and DCT2 of 5-mo-old Nphp1+/+ and Nphp1−/− mice upon ALP treatment. n = 3 male mice for each genotype/treatment. Each dot represents one cilium. (E) qRT-PCR analysis of Col1a1 expression from 5-mo-old Nphp1+/+ and Nphp1−/− kidneys upon ALP treatment. Each dot represents one individual mouse. For D and E, bars indicate mean. One-way ANOVA followed by Holm–Sidak’s posttest: *P < 0.05, **P < 0.01, ns: not significant. (F) Significantly differentially expressed genes (DEGs) detected by RNA-seq in 5-mo-old Nphp1−/− mice upon ALP treatment. (Left) Heatmap of the 112 genes from the dataset of Nphp1+/+ (n = 4), Nphp1−/− PBS (n = 5), and Nphp1−/− ALP (n = 5) treated mice using signal log-ratio values. Each row represents a gene with up- (red) and down-regulated (blue) expression. (Right) Pertinent down- (light gray) or up-regulated (dark gray) pathways or processes involving these genes highlighted using Metascape. ECM, extracellular matrix; TAL, thick ascending limb of the loop of Henle. |

Effect of Taprenepag, an EP2 agonist, on the Nphp1−/−-associated retinopathy. (A) Representative images of H&E staining of retina sections from P21-old Nphp1+/+ and Nphp1−/− mice treated every 3 d with vehicle (5% Solutol) or Taprenepag (18 mg/kg) from P6 to P21. (Scale bar, 50 µm.) (B) Quantification of ONL/OPL thickness ratio in retinas from P21 Nphp1−/− mice treated with vehicle (n = 8) or Taprenepag (n = 9). Each dot represents one mouse. Bars indicate mean. (C) Scotopic ERG recordings of P21-old Nphp1+/+ or Nphp1−/− retinas upon vehicle or Taprenepag treatment. (D) Quantification of scotopic a- (Left) and b-wave (Right) amplitude versus stimulus intensity (log) in P21 Nphp1−/− mice treated by vehicle (SOL, n = 6) or Taprenepag (n = 7). Mann–Whitney U test: *P < 0.05, ns: not significant. Dots indicate mean ± SEM. INL, inner nuclear segment; IPL, inner plexiform layer; IS, inner segment; ONL, outer nuclear segment; OPL, outer plexiform layer; OS, outer segment; RPE, retinal pigmented epithelium; SOL, Solutol; TAP, Taprenepag. |
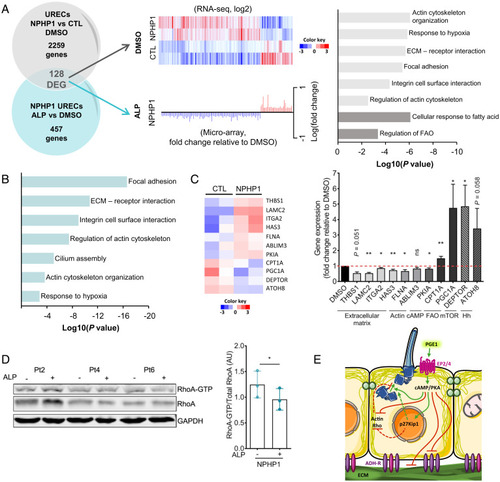
Transcriptomic analyses of molecular targets upon ALP treatment in NPHP1 URECs. (A, Left) Venn diagram shows the number of significantly DEGs detected by microarray in URECs derived from NPHP1 patients (NPHP1) and CTL individuals upon ALP treatment versus DMSO (457 regulated genes) in comparison to the number of dysregulated genes detected by RNA-seq in NPHP1 vs. CTL URECs (2,259 regulated transcripts). The 128 genes regulated by ALP inversely modulated in NPHP1 URECs (128 DEG) are underlined. (Center, Upper) Heatmap of the 128 DEGs from the RNA-seq dataset of NPHP1 (n = 2) and CTL (n = 2) URECs using signal log ratio values. Each row represents a gene with up- (red) and down-regulated (blue) expression. (Center, Lower) Fold-change and normalized expression of the 128 DEGs in one NPHP1 UREC (Pt1) selected from the microarray dataset. n = 3 experiments. (Right) Pertinent down- (light gray) or up-regulated (dark gray) pathways or relevant processes involving these genes were highlighted using Metascape. (B) Pertinent pathways or processes involving ciliary modulators dysregulated in NPHP1 URECs upon ALP treatment were highlighted using Metascape. (C, Left) Heatmap of 11 selected genes of the 128 DEGs from RNA-seq dataset of NPHP1 versus CTL URECs. (Left) qRT-PCR validating the positive effect of ALP treatment on the expression of the 11 selected dysregulated genes in NPHP1 URECs (n = 5). Paired Student’s t test: **P < 0.01, *P < 0.05, ns: not significant. Bars indicate mean ± SEM. n = 2 experiments. Hh: Hedgehog. (D, Left) Representative image of Western blot analysis showing the activation of RhoA in NPHP1 URECs (Pt, n = 3) after 24 h of treatment with DMSO (0.04%) or ALP (2 µM). (Right) Quantification of the relative abundance of RhoA-GTP in NPHP1 URECs. Each dot represents one individual cell line. Mean ± SEM. n = 3 experiments. (E) Pathways regulated by ALP/PGE1 in URECs. ADH-R, adhesion receptors. (C and D) Paired Student’s t test: **P < 0.01, *P < 0.05, ns: not significant. |

ZFIN is incorporating published figure images and captions as part of an ongoing project. Figures from some publications have not yet been curated, or are not available for display because of copyright restrictions. |