FIGURE SUMMARY
Title

Cigarette smoke-induced oxidative stress activates NRF2 to mediate fibronectin disorganization in vascular formation

Authors
Xue, J., Liao, Q., Luo, M., Hua, C., Zhao, J., Yu, G., Chen, X., Li, X., Zhang, X., Ran, R., Lu, F., Wang, Y., Qiao, L.
Source
Full text @ Open Biol.

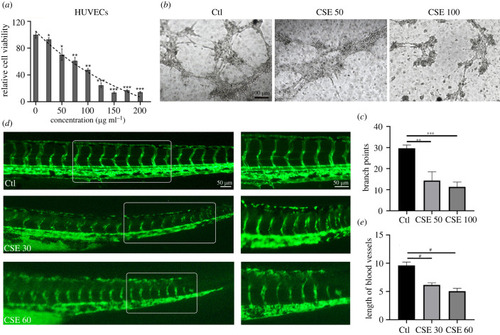
CSE disturbed vasculature formation in HUVECs and zebrafish. (a) HUVEC viability after exposure to CSE at different concentrations for 24 h. (b) Tube formation assay for HUVECs cultured on Matrigel with CSE treatment. (c) Quantification of the vascular branch points formed by HUVECs. (d) Representative images of vasculature formation in flk::GFP zebrafish treated with CSE for 48 h. (e) The vessel length was quantified from control and CSE-treated groups (n = 18). Data presented are the mean ± s.e.m. Unpaired Student's t-test, #p < 0.0001, ***p < 0.001, **p < 0.01, *p < 0.05.

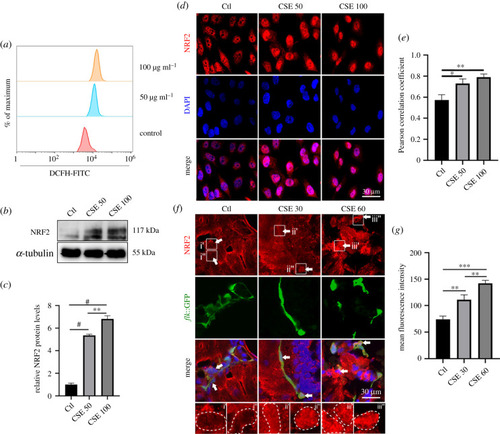
Figure 2. NRF2 was stimulated in CSE-induced vascular damage. (a) FACS for ROS generation in HUVECs exposed to CSE for 6 h. (b,c) NRF2 protein expression levels in HUVECs after 24 h of being exposed to CSE. (d,e) Representative immunofluorescence images and Pearson correlation coefficient analysis show nuclear localization of NRF2 and 4′,6-diamidino-2-phenylindole (DAPI) in HUVECs exposed to CSE for 24 h. (f,g) Representative immunofluorescence images and the statistics of average fluorescence intensity for NRF2 nuclear localization in vascular endothelial cells of flk::GFP zebrafish embryos exposed to CSE for 48 h (the arrows indicate the nuclei of the vascular endothelial cells) (n = 10). Data presented are the mean ± s.e.m. Unpaired Student's t-test, #p < 0.0001, ***p < 0.001, **p < 0.01, *p < 0.05. DCFH, dichlorofluorescein diacetate; FITC, fluorescein isothiocyanate.

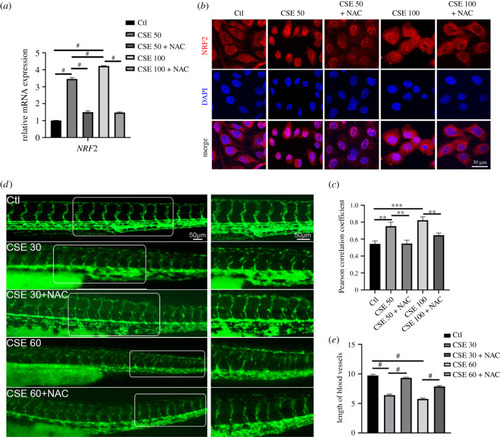
Elimination of ROS accumulation rescued the disrupted blood vessel. (a) The NRF2 mRNA expression level was examined in HUVECs exposed to different CSE concentrations with or without NAC (1 mM) for 24 h. (b) Representative images indicated NRF2 nuclear localization from different treated groups. (c) Pearson correlation coefficient for the co-localization of NRF2 and DAPI. (d) Representative images for the flk::GFP zebrafish with or without NAC (5 mM) under different concentrations of CSE. (e) Blood vessel lengths were quantified for different treatments (n = 16). Data presented are the mean ± s.e.m. Unpaired Student's t-test, #p < 0.0001, ***p < 0.001, **p < 0.01, *p < 0.05.

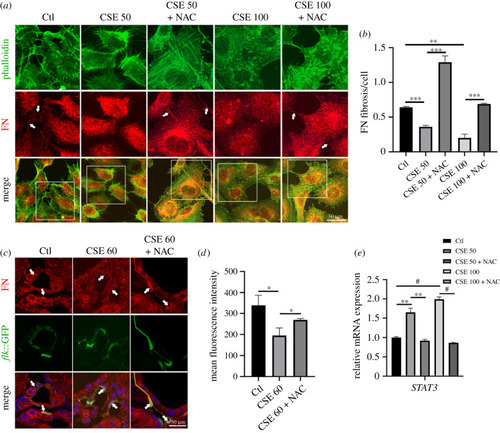
Oxidative stress induced by CSE caused abnormal FN assembly. (a) Immunofluorescence staining for FN and phalloidin in CSE-exposed HUVECs treated with or without NAC (the arrows indicate FN fibrils). (b) Quantification of the counts of FN fibrils in HUVECs. (c) Immunostaining for FN matrix among vascular endothelial cells in CSE-exposed zebrafish embryos treated with or without NAC (5 mM) for 48 h (the arrows indicate FN fibrils among the flk+ cells). (d) Quantitative analysis of the FN matrix among vascular endothelial cells (n = 9). (e) Quantitative polymerase chain reaction (qPCR) for the expression levels of STAT3 mRNA in CSE-exposed HUVECs treated with or without NAC (1 mM) for 24 h. Data presented are the mean ± s.e.m. Unpaired Student's t-test, #p < 0.0001, ***p < 0.001, **p < 0.01, *p < 0.05.

NRF2 inhibition restored abnormal angiogenesis induced by CSE. (a) Representative images showed angiogenic capacities in CSE-exposed HUVECs treated with or without NRF2 inhibitor (2.5/5 µM). (b) Quantification of the blood vessel branch points formed by HUVECs. (c) Representative immunofluorescence images of FN fibrils and phalloidin in HUVECs with CSE and NRF2 inhibitor treatment (the arrows indicate FN fibrils). (d) Quantification of the counts of FN fibrils in HUVECs. (e,f) flk::GFP zebrafish embryos were exposed to CSE with or without NRF2 inhibitor (25 µM) and vasculature formation was observed at 48 h; the blood vessel length was also quantified (n = 15). (g) Immunostaining for FN matrix among vascular endothelial cells in CSE-exposed flk::GFP zebrafish embryos with or without NRF2 inhibitor (the arrows indicate FN fibrils among the flk+ cells). (h) Quantification of the mean fluorescence intensity of FN among GFP-positive cells (n = 9). Data presented are the mean ± s.e.m. Unpaired Student's t-test, #p < 0.0001, ***p < 0.001, **p < 0.01.

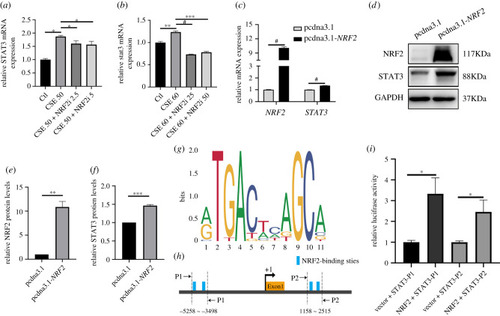
Figure 6. NRF2 regulated STAT3 at the transcriptional level. (a) qPCR for the expression levels of STAT3 mRNA in CSE-exposed HUVECs treated with or without NRF2 (2.5/5 µM) inhibitor for 24 h. (b) qPCR for the expression levels of stat3 mRNA in CSE-exposed zebrafish treated with or without NRF2 (25/50 µM) inhibitor for 24 h. (c) STAT3 mRNA expressions were examined with NRF2 overexpression in 293FT cells at 48 h. (df) Analysis of the STAT3 protein level by immunoblot with NRF2 overexpression in 293FT cells at 48 h. (g) NRF2-binding motifs from the JASPAR database. (h) Schematic representations of the STAT3 promoter region. Two pairs of primers were designed to flank the potential NRF2-binding sites within the STAT3 promoter. (i) Dual-luciferase assays of transcription with or without NRF2 overexpression. Data presented are the mean ± s.e.m. Unpaired Student's t-test, #p < 0.0001, ***p < 0.001, **p < 0.01, *p < 0.05.

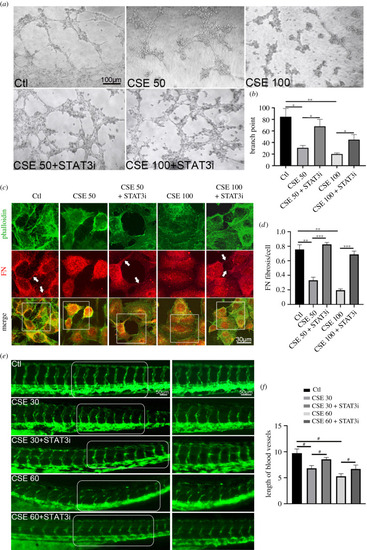
Figure 7. STAT3i rescued disrupted angiogenesis induced by CSE. (a) Representative images show angiogenic capacities in CSE-exposed HUVECs treated with or without STAT3i (5 µM) at 24 h. (b) Quantification of the blood vessel branch points formed by HUVECs. (c) Representative immunofluorescence images of FN and phalloidin expression in HUVECs with CSE treatment (the arrows indicate FN fibrils). (d) Quantification of the counts of FN fibrils in HUVECs. (e,f) flk::GFP zebrafish embryos were exposed to CSE with or without STAT3i (50 µM) and vasculature formation was observed at 48 h; the blood vessel length was also quantified (n = 20). Data presented are the mean ± s.e.m. Unpaired Student's t-test, #p < 0.0001, **p < 0.01, *p < 0.05.

Acknowledgments
This image is the copyrighted work of the attributed author or publisher, and ZFIN has permission only to display this image to its users. Additional permissions should be obtained from the applicable author or publisher of the image. Full text @ Open Biol.