
- Title
-
Zebrafish airinemes optimize their shape between ballistic and diffusive search
- Authors
- Park, S., Kim, H., Wang, Y., Eom, D.S., Allard, J.
- Source
- Full text @ Elife

( |

Each panel shows the examination of a single representative airineme as it emerges from the source cell at |
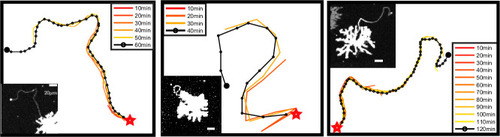
Each panel shows the examination of a single representative airineme as it emerges from the source cell at |
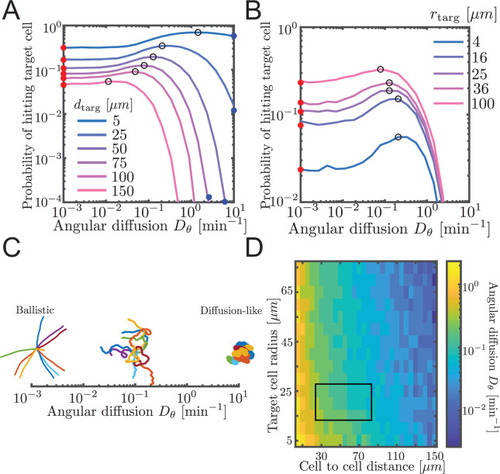
For the model parameter |

For the model parameter |

Same as |
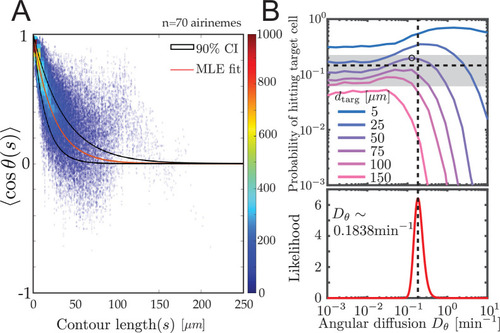
( |

( |

( |
( |
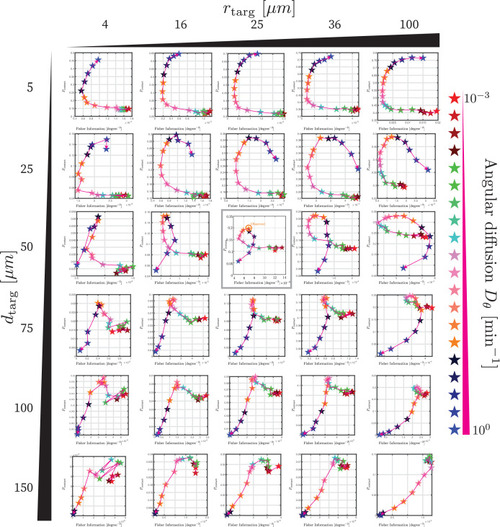
Each plot shows, identically to |