
- Title
-
In Vivo Functional Assay in Fish Gills: Exploring Branchial Acid-Excreting Mechanisms in Zebrafish
- Authors
- Shih, S.W., Yan, J.J., Tsou, Y.L., Lu, S.W., Wang, M.C., Chou, M.Y., Hwang, P.P.
- Source
- Full text @ Int. J. Mol. Sci.
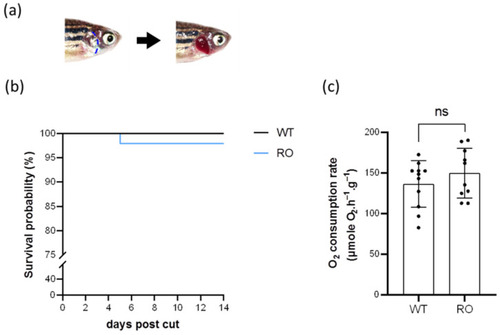
Figure 1. Effects of removal of the opercula on the survival rate and oxygen consumption rate. The opercula were cut along the blue dashed line, and the schema of opercula-removed zebrafish is shown (a). The survival rate (N = 50) (b) and oxygen consumption rate (N = 10–11) (c) were recorded after the opercula were removed. Values are the mean ± SD. Student’s t-test. ns = not significant. WT = wild type. RO = removal of the opercula.
|

Figure 2. H+ activities at different positions in the gills. The diagram of the scanning ion-selective electrode technique (SIET) device is shown (a). Three measured positions (A, B, and C) between each gill arch are shown in (b). The H+ gradients at different positions of the gills were measured by the SIET (N = 6) (c). The dotted line represents the same fish.
|

Figure 3. Effects of acid acclimation on the number of HR ionocytes and the expression of HA in the gills. The number of HR ionocytes and the fluorescence intensity of Atp6v1a signals in the gills were analyzed by immunofluorescence (IF) after acid acclimation (a). HR ionocyte number of filaments (N = 12) (b), mean fluorescence intensity of individual HR ionocytes (N = 1894–6144) (c), and average mean fluorescence intensity of HR ionocytes of filaments (N = 12) (d) were presented. The protein expression of HA in the gills acclimated to acid environments was analyzed by Western blot. The blots showed the bands with molecular weights corresponding to Atp6v1a and Gapdh (approximately 70 kDa and 35 kDa, respectively) (e). The protein expression of HA was quantified and normalized to Gapdh (N = 6) (f). Values are the mean ± SD or SEM. Student’s t-test or Mann–Whitney U test, * p < 0.05, **** p < 0.0001.
|
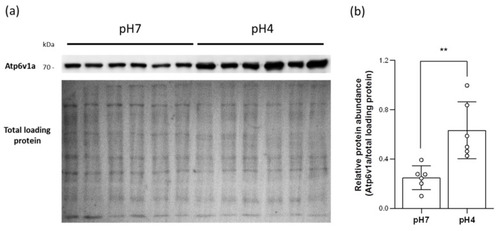
Figure 4. Effects of acid acclimation on the HA accumulation in the plasma membranes of the gills. The protein expression of HA in the branchial plasma membranes acclimated to acid environments was analyzed by Western blot. The blots showed the band with a molecular weight corresponding to Atp6v1a (approximately 70 kDa), and the PVDF membrane stained by ponceau S showed bands of total loading proteins (a). The protein expression of HA was quantified and normalized to total loading protein (N = 6) (b). Values are the mean ± SD. Student’s t-test, ** p < 0.01.
|

Figure 5. Effects of acid acclimation on the branchial H+-excreting capacity. The H+ gradient at the gills of adult fish was measured by the SIET after 7 days of acclimation to acidic conditions. Values are the mean ± SEM (N = 7). Mann–Whitney U test, *** p < 0.001.
|

Figure 6. Effects of BAF and EIPA on the branchial H+-excreting capacity. H+ gradients at the gills were analyzed before and after BAF (a) or EIPA (b) treatments by the SIET. The dashed line represents the same fish. Values are the mean ± SD (N = 5). Student’s t-test, ** p < 0.01. BAF = bafilomycin A1. EIPA = 5-ethylisopropyl amiloride.
|