
- Title
-
Incomplete Recovery of Zebrafish Retina Following Cryoinjury
- Authors
- Džulová, D., Lawless, D., Pinton, G.G., Renner, N.A., Schorderet, D.F.
- Source
- Full text @ Cells

Figure 1. GFP retinal half-mounts showing the resolve of the lesion with the remaining scar; arrows point to the optic nerve for easier orientation: (i) (A) Uninjured (0 dpi) retinal half-mount with no lesion. (B,C) 1 and 2 dpi: lesion area is represented with a *, corresponding to a darker shaded area within the half-mount. (D) 3 dpi: the original circular lesion (*) has changed and there is a brighter margin surrounding the left side of the lesion (circled). (E) 7 dpi: reduced size of the lesion (*) and increased fluorescence within the margin. (F) 10 dpi: closing of the lesion with increased intensity of fluorescence, CMZ has been disrupted (circled). (G) 30 dpi: the lesion has resolved, and only reduced margin is visible near the CMZ (circled). (H) 60 dpi: the margin shows gathering of the tissue as the retina reaches the defect area, resulting in a fold at the site (circled). Each half-mount represents a separate animal. Scale bars represent 250 µm. (ii) Surrounding MG fluorescence intensity. The response to cryo-injury was quantified by calculating the percentages of the lesion area relative to the total area of the retinal half-mount. Linear regression was performed for (1) lesion size throughout 1–7 dpi and (2) MG proliferation between 10 and 60 dpi. A strong association for lesion size reducing from 1 to 10 dpi (p value = 0.00626). MG proliferation was notably increased from 10 dpi (p-value 0.0508, ns). Time points 1 dpi, 2 dpi and 3 dpi n = 5 independent animals and time points uninjured, 7 dpi, 10 dpi, 30 dpi and 60 dpi contain n = 6 independent animals.
|

Figure 2. Hematoxylin and eosin staining: (A) Control staining in uninjured retina (0 dpi) with distinct retinal layers. (B) 1 dpi: edema in the lesion area particularly affecting the IPL and INL. (C) 2 dpi: severe edema causing a major disruption to majority of the retinal layers. (D) 3 dpi: degeneration phase, coagulative necrosis involving all retinal layers and the formed ‘blister’. Low numbers of polymorphonuclear and mononuclear inflammatory cells were detected (arrow). (E) 5 dpi: remodeling phase, ‘blister’ is still present, expansion of and piling of retinal cells at the lesion periphery coincide with maximal proliferation levels (*). (F) 10 dpi: lesion size noticeably smaller in comparison to previous time points. (G) 20 dpi: lesion size reaches the thinnest point, clearing of dead cells complete. (H) 30 dpi: regrowth phase, largely regenerated retina, a clearly dysplastic region is evident exhibiting a mixture of retinal cells and absence of lamination. (I,J) 60 and 100 dpi: focal retinal reorganization, reduced number of rods and cones, inward growth of RPE, focal disruption and convergence of INL and ONL (circled). (K) 300 dpi: incomplete regeneration presenting the absence of photoreceptor outer segments (circled), dysplasia apparent with largely normal retina surrounding the affected area. Retinal layers labelled in control panel for reference; RPE—retinal pigment epithelium, ONL—outer nuclear layer, OPL—outer plexiform layer, INL—inner nuclear layer, IPL—inner plexiform layer, GCL—ganglion cell layer. 300 dpi at 40× with scale bar representing 100 µm to show the full regeneration process. Rest of scale bars represent 200 µm.
|

Figure 3. TUNEL staining: (i) (A) Control staining in uninjured retina (0 dpi). (B) 2 dpi: profound localized cell death in the area of cryoinjury, degeneration phase. Predominantly affected layers were OPL and INL. (C) 3 dpi: cell death still ongoing, but to a lesser extent than at 2 dpi, clearing off the dead cells by macrophages. (D) 7 dpi: damaged nuclei are no longer detected in the retina, reprogramming of MG, remodeling phase. All sections were counterstained with DAPI. Apoptotic cells—TMR Red; Nuclei, DAPI—blue. Retinal layers labelled in control panel for reference; RPE—retinal pigment epithelium, ONL—outer nuclear layer, OPL—outer plexiform layer, INL—inner nuclear layer, IPL—inner plexiform layer, GCL—ganglion cell layer. Scale bars represent 100 µm. (ii) Relative percentage of apoptotic cells at each time-point (n = 2), * p value = 0.02.
|

Figure 4. PCNA staining of proliferation: (i) (A) Proliferation is minimal in the control uninjured retina (0 dpi). (B) 1 dpi: proliferation begins to be detected (arrows). (C,D) 2 dpi and 3 dpi: proliferation more evident at the lesion site. (E) 5 dpi: proliferation pronounced, with positive nuclei located predominantly in the ONL at the lesion margin, absent in the lesion site (circled). (F) 7 dpi: proliferation now detected throughout the lesion. (G,H) 10 dpi and 20 dpi: proliferation started to decrease as new cells have started to repopulate the lesion site. (I,J) 30 dpi and 60 dpi: proliferation now only marginally detected (arrows). All sections were counterstained with DAPI. PCNA proliferation marker—red; Nuclei, DAPI—blue. Retinal layers labelled in control panel for reference; RPE—retinal pigment epithelium, ONL—outer nuclear layer, OPL—outer plexiform layer, INL—inner nuclear layer, IPL—inner plexiform layer, GCL—ganglion cell layer. Scale bars represent 200 µm. (ii) Relative percentage of proliferative cells at each time-point (n = 2), * p value < 0.05.
|

Figure 5. Cellular components of defect at 300 dpi: (i) (A) Uninjured retina (0 dpi) showing typical staining of cones with zpr-1 antibody. (B) Absence of restoration of cone photoreceptors within the injured retina at 300 dpi. (C) Uninjured retina (0 dpi) showing typical staining of rods with zpr-3 antibody. (D) Incomplete restoration and disorganization of rod photoreceptors within the lesion at 300 dpi. (E) Uninjured retina (0 dpi) showing typical staining of horizontal cells with zns-2 antibody. (F) Absence of horizontal cells within the lesion at 300 dpi. (G) Uninjured retina (0 dpi) showing typical staining of MG with zrf-1 antibody. ILM and OLM labelled for reference. (H) Partial restoration of MG within the residual lesion at 300 dpi. All sections were counterstained with DAPI. zpr-1, zpr-3, zns-2, zrf-1 markers—green; Nuclei, DAPI—blue. Retinal layers labelled in control panel A for reference; RPE—retinal pigment epithelium, OLM—outer limiting membrane; ONL—outer nuclear layer, OPL—outer plexiform layer, INL—inner nuclear layer, IPL—inner plexiform layer, GCL—ganglion cell layer; ILM—inner limiting membrane. Images (A,C) at 40×, rest of images at 20×. Scale bars represent 100 µm. (ii) Relative percentage of cell markers (zpr-1, zpr-3, zns-2, zrf-1) at 0–300 dpi (n = 2), * p value < 0.05; *** p value <0.005.
|

Figure 6. RT-PCR: (A) ascl1a was significantly expressed in the early stages of regeneration beginning at 2 dpi through to 7 dpi. (B) Significant expression of lin28a from 1 to 7 dpi. (C) wnt4a showed significant upregulation at 100 dpi. (D) stat3 showed no differential expression throughout any of the time points, 1–200 dpi. (E,F) mmp9 showed no changes in expression, mmp2 was downregulated throughout all time points. No expression was detected at time points 1 dpi, 2 dpi, 5 dpi, 7 dpi, 10 dpi and 20 dpi for both, mmp9 and mmp2. (G) tgfbi showed significant change in expression at 7 dpi. (H) cxcr5 showed differential expression at 1–30 dpi. No expression was detected at time points 1 dpi, 2 dpi, 5 dpi, 7 dpi, 10 dpi and 20 dpi. (I) gata3 reported no significant differential expression at any of the time points. No expression was detected at time points 1 dpi, 2 dpi, 5 dpi, 7 dpi, 10 dpi and 20 dpi. Uninjured retina—0 dpi. β-actin served as reference gene. Three independent replicates were carried out for each gene at each time point. Error bars represent +/− standard error of the mean (SEM). Stars used to denote significance * p value < 0.01, ** p value < 0.005, **** p value < 0.0001.
|
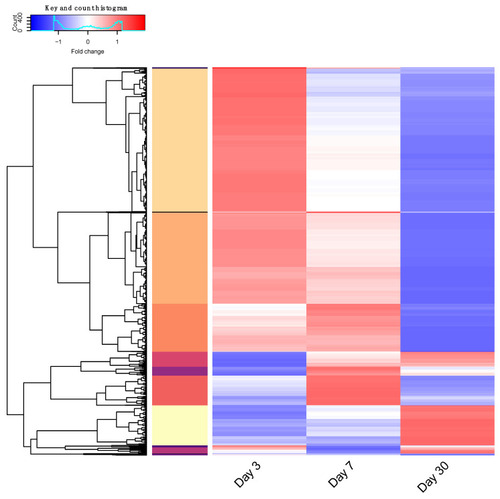
RNAseq analysis gene clustering. Genes showing differential expression over three time points scaled per-gene. Hierarchical clustering was performed, and thirteen distinct groups determined by tree height are illustrated by color in the left vertical bar. Fold change in gene expression is represented by color over days 3, 7, and 30; low—blue to high—red. Scaled expression data are listed in |