FIGURE SUMMARY
Title

Efficacy of Tricaine (MS-222) and Hypothermia as Anesthetic Agents for Blocking Sensorimotor Responses in Larval Zebrafish

Authors
Leyden, C., Brüggemann, T., Debinski, F., Simacek, C.A., Dehmelt, F.A., Arrenberg, A.B.
Source
Full text @ Front Vet Sci

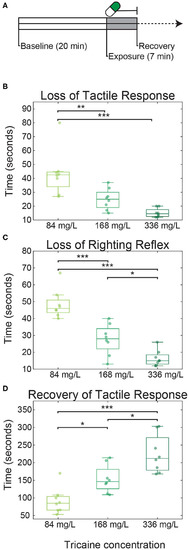
Tricaine onset and recovery in non-restrained zebrafish larvae. (A) Larvae were placed in dishes for 20 min to acclimatize (referred to as baseline), followed by 7 min of tricaine exposure. After these 7 min, larvae were transferred to a dish containing tricaine-free E3 and recovery time was assessed. Time to loss of tactile response (B), loss of righting reflex (C), and recovery (D) of tactile response were measured in larvae exposed to three concentrations of tricaine: the standard dose (168 mg/L), half this concentration, and double this concentration. Tricaine onset and recovery was dose-dependent, with lower concentrations having the slower onset and faster recovery times. Box plots show quartiles; whiskers extend to the most extreme data points not considered outliers (within 2.7 standard deviations). Results were analyzed via one-way ANOVA with Tukey's HSD test. N = 8 for all three conditions, *p < 0.05, **p < 0.005, ***p < 0.001.

Effects of tricaine and gradual cooling on the heartrate. (A) Schematic overview of the experimental setup. Fish were agarose-mounted in glass-bottom petri dishes which were modified to allow liquid to flow through only a narrow channel. The dishes had two connectors on each side in order to apply the liquids, and a sticker to ensure consistent placement of the thermal probe. During gradual cooling experiments, hot and cold E3 were dynamically applied via a peristaltic pump into a dish, where they mixed to achieve the desired temperature under control of a temperature feedback loop (see Methods). In tricaine experiments, the peristaltic pump applied tricaine at the standard concentration (168 mg/L), which was then washed out with drug-free E3. Hot and cold E3 beakers also contained 1% v/v 1,2-propanediol. (B) The experimental protocol consisted of 6 min baseline recording, 7 min tricaine or gradual cooling application, and 50 min of recovery. (C) The heartrates of larvae exposed to a standard tricaine concentration (168 mg/L), gradual cooling (11°C) and control fish. Average heart rates are shown, the SEM is shown as shaded envelope. Bars above time points indicate significant differences vs. time-matched control larvae (Tukey's HSD test, for clarity exact p-values are not shown, all p < 0.05, n = 7–8).

Figure 3. Effects of tricaine and gradual cooling on the optokinetic response. (A) Illustration of the visual stimulus (top) and the experimental protocol (bottom). A 3 min looping stimulus was presented to animals using an LED arena (Supplementary Figure 1). It consisted of a moving bar rotating at a constant velocity (18°/s) for 60 s counter-clockwise, followed by 60 s clockwise, and finally alternating between counter-clockwise and clockwise in 4 s intervals for a total of 60 s. (B) Sample traces of the eye movements evoked by the stimulus protocol during experiments carried out in the presence of the vehicle control (1% v/v 1,2-propanediol), during gradual cooling (11°C) and in the presence of tricaine at a concentration of 168 mg/L. (C,D) The dynamic range of the evoked eye movements and the number of saccades occurring during each 3 min stimulus period were analyzed and significance was determined via two-way repeated measures ANOVA with Tukey's HSD test. Horizontal colored bars indicate which time points were significantly different from respective controls, for clarity only one significance level is shown (p < 0.05). Vertical white lines indicate the 1 min stationary grating period shown in (A), as no visual stimulus was present during this time. (E) Comparison of the recovery timepoints of saccade rate and dynamic range for the different treatments. N = 4–18.

Gradual cooling induced a calcium surge in both the pretectum and hindbrain of exposed larvae. (A) Stimulus and imaging paradigm for calcium imaging experiments carried out in both the pretectum and hindbrain. (B) Median frame fluorescence for pretectal and hindbrain recordings; traces for individual recordings are shown in cyan and the mean values are shown in blue. The fluorescence trace for a single recording in the pretectum and hindbrain is shown in red, the convolved eye trace and convolved stimulus for the example recordings are also shown in gray. (C) Maximum intensity projections at different time points from the example recordings shown in red in (B). 1: before cooling, 2: during cooling to 11°C, 3: recovery 1:30 to 5:40 min after cooling ceased. Scale bars: 30 μm. (D) The onset of the calcium surge was calculated in stimulus-correlated (regressor score >0.5) pixels. This onset was defined as the first time point at which the fluorescence was >5 standard deviations above the baseline. (E) The time point at which correlated pixels reached their highest pixel intensity. A, anterior; P, posterior; L, left; R, right.

Effects of tricaine and gradual cooling on sensory and motor brain areas. (A) The duration of drug exposure was the same as in our previous experiments. Stimuli were presented alongside calcium imaging, and ceased between recordings, as shown in the schematic. Tricaine (168 mg/L and 84 mg/L) and gradual cooling treatments were applied for 7 min (Exposure). (B) During imaging of the pretectum, the stimulus consisted of alternating moving (7 s) and stationary (12 s) periods in order to determine the motion sensitivity of identified neurons. (C) For experiments in the hindbrain, the stimulus was constantly rotating (18°/s) and alternated between clockwise and counterclockwise motion every 12 s. (D,E) Motion-sensitivity of neurons detected in larvae exposed to tricaine and gradual cooling. Note that cooling treatment reduced the number of detected motion-sensitive cells and their motion-sensitivity, while the corresponding effects during tricaine treatment were less pronounced or absent. In the upper row (% Max. Cells), the number of detected neurons is expressed as a percentage of the maximum number of neurons detected via pixel-wise regressor correlation in any minute of the recording. The absolute number of identified cells in individual recordings is shown via the diameter of the data points. (F,G) The number of stimulus-associated neurons detected in the hindbrain of larvae exposed to either tricaine or gradual cooling was decreased. The dynamic range of eye positions is shown in the top row. Plots in (D–G) differ in style, because in (D,E) we assessed two parameters (motion sensitivity and number of cells, each represented by the circles) and only one parameter (number of cells) in (F,G). Results were binned per phase into baseline, treated, recovery, recording 2 and recording 3 and analyzed via two-way repeated measures ANOVA with Tukey's HSD test, n = 4–7. *p < 0.05, ***p < 0.001.

Reduced sensorimotor activity in pretectum and hindbrain after application of tricaine and gradual cooling anesthesia. (A–D) Summary of the results from Figure 5 highlighting the main treatment effects on the number of identified cells in the pretectum (A), the motion-sensitivity index of remaining pretectal neurons (B), the number of identified cells in the hindbrain (C), and the dynamic range of eye movements observed (D). In (A), the number of remaining motion-sensitive neurons relative to the maximal number of motion-sensitive neurons detected in the recording is quantified. Results were binned per phase into baseline, treated, recovery, recording 2 and recording 3 and analyzed via two-way repeated measures ANOVA with Tukey's HSD test, n = 4–7. *p < 0.05, ***p < 0.001. (E,F) Top: Pair-wise neuronal cross-correlation matrices for the hindbrain of larvae treated with 168 mg/L tricaine or cooled to 11°C. y and x axes of each matrix correspond to the neuronal ROIs sorted according to their individual correlation to the clockwise stimulus. Cross-correlation matrices were calculated for the five different time periods shown and in each displayed matrix, the matrices of all individual recordings and larvae were averaged (a weighted average that took into account the number of ROIs per recording). Bottom: The 20% most correlated (positively or negatively) ROIs are shown. Stimulus traces show expected activity of a CW stimulus-correlated ROI (i.e., the kinetics-adjusted stimulus regressor see Methods).

Schematic illustrating the differential effects of 168 mg/L tricaine and 11°C cooling on physiological parameters and the optokinetic response, as well as their respective time courses.

Acknowledgments
This image is the copyrighted work of the attributed author or publisher, and ZFIN has permission only to display this image to its users. Additional permissions should be obtained from the applicable author or publisher of the image. Full text @ Front Vet Sci