
- Title
-
Functional Characterization of the MYO6 Variant p.E60Q in Non-Syndromic Hearing Loss Patients
- Authors
- Alkowari, M., Espino-Guarch, M., Daas, S., Abdelrahman, D., Hasan, W., Krishnamoorthy, N., Sathappan, A., Sheehan, P., Panhuys, N.V., The Qatar Genome Program Research Consortium, ., Estivill, X.
- Source
- Full text @ Int. J. Mol. Sci.

Figure 1. Mutation analysis of c.178G>C MYO6 variant. (A) Sanger sequence of heterozygous and homozygous missense c.178G>C variant in exon 3 of MYO6. (B) Schematic diagram of myosin VI protein. (C) MYO6 ontology across multiple species highlighting the conserved E60 residue.
|

Figure 2. (A) Molecular protein structure of the motor domain of MYO6 showing E60 and the p.E60Q variant. (B) ATPase activity assay of whole-cell lysates from transfected HeLa cells with plasmids carrying human MYO6WT and MYO6p.E60Q. Enzyme activity was measured using a malachite green-based colorimetric assay. Values are represented as the mean ± SEM from independent experiments. Statistically significant differences were assessed by unpaired t-test, * p < 0.05.
|
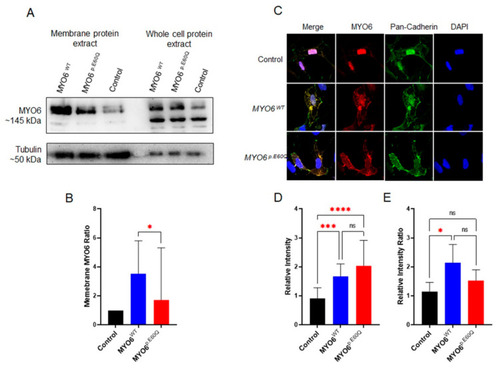
Figure 3. Cellular analysis of novel MYO6 variant. (A) Western blot of whole-cell lysates and membrane proteins from HeLa cells transfected with plasmids carrying human MYO6WT and MYO6p.E60Q. (B) Quantification ratio of the normalized integrated density of MYO6 expression from membrane/whole proteins. (C) Representative immunofluorescence staining images of HeLa cells labeled by MYO6 (red), pan-cadherin (green), and DAPI (blue). (D) Quantification of the relative fluorescence intensity of MYO6. (E) Quantification of the ratio of the normalized relative fluorescence intensity of MYO6/pan-cadherin. All values are represented as the mean ± SEM from independent experiments. Statistically significant differences were assessed by (B) unpaired t-test, * p < 0.05 or (D,E) one-way ANOVA followed by Tukey’s multiple comparisons, * p < 0.05; *** p = 0.0001; **** p < 0.0001.
|
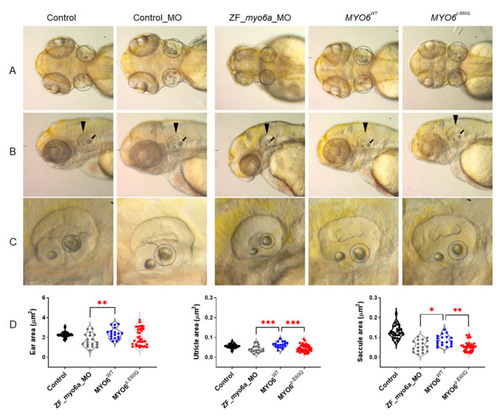
Figure 4. Detection of ear morphological defects in zebrafish models. (A) Dorsal view of zebrafish at 72 hpf. (B) Lateral view of the posterior otolith at 72 hpf zebrafish (black arrow). (C) Closeup view of zebrafish ear morphology (black dashed circle). (D) The perimeter length of zebrafish ear, utricle, and saccule area in μm2. The total number of experiments was 3, and the number of embryos analyzed was 31, 18, 19, and 36 for control, ZF_myo6a_MO, MYO6WT, and MYO6p.E60Q groups, respectively. One-way ANOVA using GraphPad Prism software (version 8.0) and Tukey’s multiple comparisons test with p-values of * p < 0.05, ** p < 0.01, *** p < 0.001.
PHENOTYPE:
|

Figure 5. Inner ear hair cell characterization. Representative image of inner ear hair bundle phenotype of zebrafish larvae at 72 hpf of (A) Control, (B) ZF_myo6a_MO total knock-out, and the rescue with (C) wild type MYO6p.E60Q and (D) MYO6p.E60Q mutation. Representative image of inner ear hair bundle phenotype of zebrafish larvae at 72 hpf. F-actin-rich hair bundles were visualized using fluorescent acetylated tubulin and visualized using Airyscan confocal microscopy at a magnification of 100×.
EXPRESSION / LABELING:
PHENOTYPE:
|
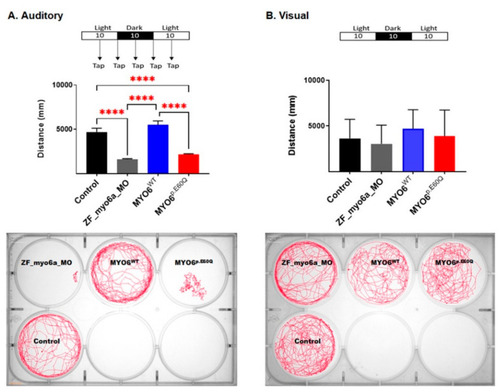
Figure 6. Auditory-sensory behavioral response in zebrafish larvae was examined by assessing locomotive behavior recorded through the presentation of light–dark cycles over time intervals of 30 min and tapping. The total distance moved by zebrafish larvae was calculated using Ethovision software (Noldus). (A). Auditory-sensory behavioral response. (B). Visual-sensory behavioral response. Representative behavior and response activity to auditory-sensory stimuli of zebrafish groups measuring movements over time for the examined zebrafish groups; movement is shown by the drawn red lines. The number of experiments n = 4; values represent mean with standard deviation. Statistical analysis was performed with one-way ANOVA followed by Tukey’s multiple tests for multiple comparisons, **** p < 0.0001.
PHENOTYPE:
|