FIGURE SUMMARY
Title

p70S6 kinase regulates oligodendrocyte differentiation and is active in remyelinating lesions

Authors
Benardais, K., Ornelas, I.M., Fauveau, M., Brown, T.L., Finseth, L.T., Panic, R., Deboux, C., Macklin, W.B., Wood, T.L., Nait-Oumesmar, B.
Source
Full text @ Brain Commun

Developmental expression profile of pS6RP in oligodendroglial cells. (AE) Co-immunolabelling of pS6RP and Sox10 at PND 4 (A), PND 7 (B), PND 10 (C), PND 21 (D) and PND 30 (E) in the spinal cord. Double-positive cells are indicated by arrows. (F) Quantification of pS6RP+Sox10+ cells shows a peak of pS6RP expression between PND7 and PND10, indicating that pS6RP expression is regulated in oligodendroglial cells during development. Data represent mean ± SEM; N = 3 independent experiments for each developmental stage. ANOVA followed with post hoc Tukey's pairwise multiple comparison tests: *P < 0.05; **P < 0.01; ***P ≤ 0.001; ****P ≤ 0.0001. Panels (AE) are counterstained with DAPI. Scale bar (AE): 50 µm.

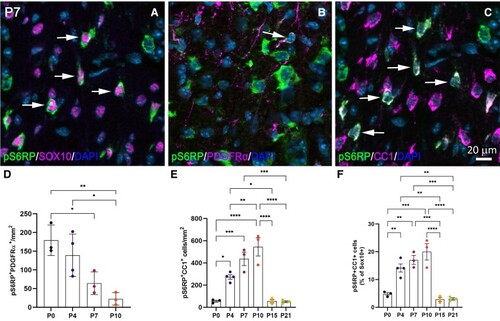
Characterization of pS6RP expression in oligodendroglial cells. (AC) Co-immunolabelling for pS6RP and Sox10 (A), pS6RP and PDGFRα (B), pS6RP and CC1 (C) in the dorsal funiculus of PND7 WT mice. Double-positive cells are indicated by arrows. (D) Number of pS6RP+PDGRα+ OPCs/mm2 from PND0 to PND10. (E) The number of CC1+ differentiated oligodendrocytes expressing pS6RP from PND0 to PND21. Note that pS6RP is transiently expressed in CC1+ differentiated oligodendrocytes. (F) Although transient, pS6RP is predominantly located in CC1+ differentiated oligodendrocytes between PND4 and PND10. Data represent mean ± SEM; N = 3 independent experiments for each developmental stage. ANOVA followed with post hoc Tukey's pairwise multiple comparison tests: *P < 0.05; **P < 0.01; ***P ≤ 0.001; ****P ≤ 0.0001. Panels (AC) are counterstained with DAPI. Scale bar (A–C): 20 µm.

Expression of pS6RP in LPC-induced demyelinated lesions. (A) Expression of pS6RP in the saline-injected spinal cord. (B) pS6RP immunolabeling in LPC-induced demyelinated spinal cord at 7 dpi. pS6RP is upregulated in the LPC lesion of the dorsal funiculus (dashed lines). (C) Co-immunolabelling of pS6RP and GFAP. Note that GFAP+ astrocytes are not stained with the anti-pS6RP antibody. (D) Co-immunolabelling of pS6RP and CD45 reveals expression in few monocytes/macrophages (arrowhead, inset). (E) Triple immunostaining for pS6RP, Sox10 and CC1. Inset (E) illustrates the expression of pS6RP in Sox10+CC1+ oligodendrocytes in the lesion at 7 dpi (arrowheads). (F) Quantification of pS6RP-expressing oligodendrocytes showed a peak of pS6RP expression at 14 dpi, coinciding with the remyelination phase of the lesion. Data represent mean ± SEM; N = 3 independent experiments at each timepoint. ANOVA followed with post hoc Tukey's pairwise multiple comparison tests: **P ≤ 0.01. Scale bars: (A and B), 100 µm; (C and E), 50 µm; (D), 20 µm.

pS6RP expression during EAE in mouse spinal cord. (A) pS6RP immunolabelling in the naive adult spinal cord. Note that pS6RP is mainly detected in motor neurons and absent in white matter in the naive adult spinal cord. (B) pS6RP immunostaining in MOG-induced EAE lesions of the spinal cord. Inflammatory foci are indicated by arrowheads. (CE3) pS6RP-expressing cells within EAE lesions are predominantly CD45+ cells (C, insets C1–C3) or Sox10+ (D, insets D1–D3) and CC1+ (insets E1–E3) oligodendrocytes. Arrows in insets indicate double-positive cells. Scale bars: (A and B), 100 µm; (C and D), 50 µm; (C1–C3, D1–D3), 10 µm; (E1–E3), 20 µm.

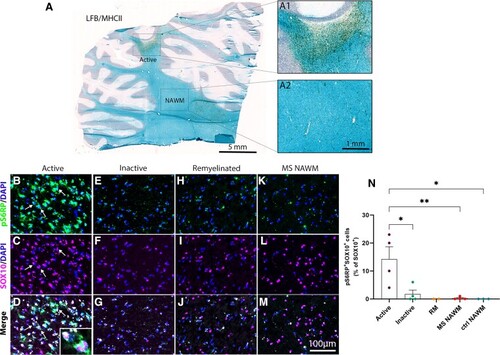
Immunodetection of pS6RP in MS lesions. (A) Luxol fast blue/MHCII staining illustrating an active MS lesion located in the cerebellar white matter. The boxed areas in panel A illustrate a typical active plaque filled with MHCII+ immune cells (A1) and the normal-appearing white matter (A2), respectively. Co-immunolabelling for pS6RP (green) and Sox10 (magenta) indicates that pS6RP is mainly detected in oligodendroglia (arrows) in active (BD, inset in D) but not in chronic inactive (EG) nor in remyelinated lesions (HJ) and normal-appearing white matter (KM). Quantification of the percentage of Sox10+ oligodendroglial cells expressing pS6RP in different MS lesions subtypes and normal-appearing white matter from MS and controls cases (N). Data represent mean ± SEM for each MS lesion type. Active: active lesions (n = 3) and rims of chronic active lesions (n = 1); Inactive: Chronic inactive (n = 3) and core of chronic active (n = 1) lesions; RM: remyelinated lesions (n = 2); MS NAWM: normal-appearing white matter from MS cases (n = 4); Ctl NAWM: normal-appearing white matter from controls (n = 3). ANOVA followed with post hoc Tukey's pairwise multiple comparison tests: *P ≤ 0.05; **P ≤ 0.01. Panels (B–M) are counterstained with Dapi. Scale bars: (A), 5 mm; (A1 and A2), 1 mm; (BM), 100 µm.

p70S6K1 activity correlates with and regulates the onset of MBP expression in primary rat OPCs in vitro. (AD) Immunostaining for MBP (green) and pS6RP (pink) in primary rat OPCs after 3 days (A and B) or 5 days (C and D) of differentiation in the absence (A and C) or presence (B and D) of PF-4708671 (10 µM). Nuclei are stained with Dapi (blue). (EG) Graphs indicating the percentage of cells at each timepoint that were MBP+ (E), pS6RP+ (F) and MBP+PS6RP+ (G). (H) Immunostaining for pS6RP after 5 days in control differentiation media (same image as panel C) showing both bright (brt) and low or diffuse staining for pS6RP. (I) Graph indicating percentage of PS6RP+ cells at each timepoint that was bright. (J) Graph indicating percentage of MBP+ cells at each timepoint that were also PS6RP+. An unpaired two-tailed t-test with Welch's correction if variances are unequal: *P < 0.0001 for all graphs with the exception of panel E (3 days, P = 0.0272 and 5 days, P = 0.0049). Scale bars (AD and H), 100 µm.

Inhibiting S6K1 kinase activity in oligodendrocytes decreases myelin production in vivo. (A) The per cent of dorsally migrated Olig2+ cells that were Olig2+/Sox10+ in the ventral spinal cord of zebrafish treated with p70S6K1 inhibitor PF-4708671 from 2 to 3 dpf. ANOVA F(3,33) = 1.971, ns, P = 0.1374. (B) The per cent of all Olig2+ dorsally migrated cells that were Mbp+/Olig2+ treated with p70S6K1 inhibitor PF-4708671 from 2 to 4 dpf. ANOVA F(3,51) = 7.275, P = 0.004, Dunnett's multiple comparisons test adjusted P-value **P = 0.0012–0.0032, ***P = 0.0006, n = 9–15 fish per treatment group. (CE) Representative images of myelin internodes. Zebrafish embryos were injected with pMBP:mEGFP along with a second plasmid to manipulate S6K1 function, labelled with cytoplasmic RFP or treated with the mTOR inhibitor rapamycin from 2 to 4 dpf. All images were taken in the ventral spinal cord above the yolk sac extension. (C) WT cell expressing pMBP:mEGFP to label internodes. (D) A cell expressing both pMBP:mEGFP to label internodes and pMYRF:S6K1-KR to inhibit S6K1 function, labelled with red fluorescent protein (arrowhead). (E) pMBP:mEGFP+ cell in rapamycin-treated zebrafish. (F) Quantification of myelin internode length averaged per cell. Internode length: ANOVA, F(2,24) = 2.731, ns, P = 0.0854. (G) Quantification of myelin internode number averaged per cell. ANOVA, F(2,24) = 10.25, P = 0.0006; with Tukey's multiple comparisons test adjusted P-value: **P = 0.0024, ***P = 0.0009, (H) Sum of myelin produced per cell. ANOVA, F(2,24) = 8.259, P = 0.0019; with Tukey's multiple comparisons test adjusted P-value: *P = 0.0026, **P = 0.014. All images were analysed in 3D using IMARIS software. n = 10–14 cells per condition (one cell per fish). Scale bars (CE), 25 µm.

Acknowledgments
This image is the copyrighted work of the attributed author or publisher, and ZFIN has permission only to display this image to its users. Additional permissions should be obtained from the applicable author or publisher of the image. Full text @ Brain Commun