
- Title
-
Elevated Hoxb5b Expands Vagal Neural Crest Pool and Blocks Enteric Neuronal Development in Zebrafish
- Authors
- Howard, A.G.A., Nguyen, A.C., Tworig, J., Ravisankar, P., Singleton, E.W., Li, C., Kotzur, G., Waxman, J.S., Uribe, R.A.
- Source
- Full text @ Front Cell Dev Biol
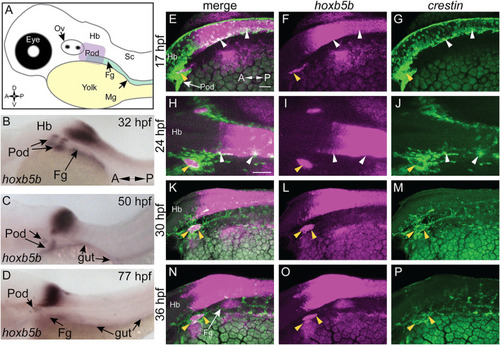
hoxb5b is expressed during early NCC development. (A) Schematized embryo illustrating approximate locations of major relevant anatomical features, namely the post-otic domain (POD), eye, yolk, Otic Vesicle (Ov), Hindbrain (Hb), presumptive spinal cord (Sc), foregut mesenchyme (Fg), and Midgut mesenchyme (Mg). (B–D) in situ hybridization demonstrating hoxb5b expression in the posterior Hb, POD, and Fg during the second through third day of development. (E–P) Hybridization Chain Reaction probes against crestin and hoxb5b highlight their overlapping domains in the POD (yellow arrowheads) and along the dorsal length (white arrowheads). Scale bars E,H: 50 μM. |
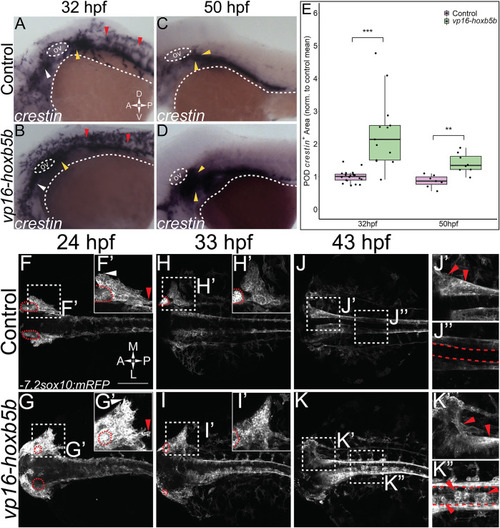
Elevated Hoxb5b activity globally increases both number and localization of neural crest cells. (A–D) in situ hybridization for NCC using a crestin probe at both 32 hpf (A,B) and 50 hpf (C,D). crestin + domains for embryos injected with 15 pg of vp16-hoxb5b mRNA (B,D) were expanded in the post-otic (yellow arrowheads), cranial (white arrowheads), and spinal cord (red arrowheads), compared to uninjected embryos (A,C). (E) Quantification of expanded vagal crestin + domains shows significant expansion at both 32 hpf (control n = 27; vp16-hox5b n = 21; p = 3.03 × 10⁻⁵) and at 50 hpf (control n = 7; vp16-hox5b n = 8; p = 0.00114). (F–K) Maximum intensity projection stills taken from confocal time lapse movies of sox10:mRFP embryos. Controls (n = 2) were compared to 30 pg vp16-hoxb5b injected embryos (n = 4), examined from 24 hpf to 43 hpf and serially imaged along the dorsal aspect of the vagal domain. mRFP+ NCCs are grossly expanded in the vagal domain (G,G’ arrowheads) over controls (F,F’, arrowheads). This expansion persists through the course of development, resulting in ectopically localized cells along the dorsal aspect of the embryo (K”) and in the post-otic pool (K’). Scale Bars in (F): 100 μM. Anterior: Left. |
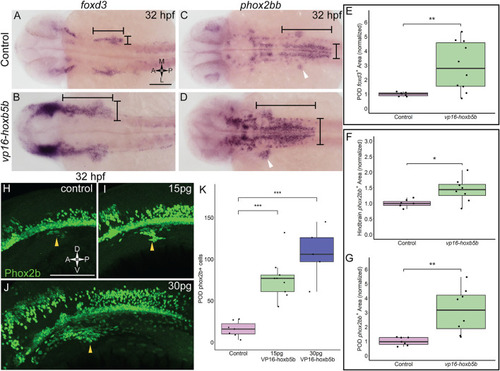
Elevated Hoxb5b activity expands the expression domains of vagal markers foxd3 and phox2bb during the first day in development. (A,B) in situ hybridization against foxd3, a marker for multipotent NCCs at this stage, in 32 hpf embryos injected with 30 pg vp16-hoxb5b, were compared to WT controls. (C,D) in situ hybridization against phox2bb, an autonomic NCC marker, in 32 hpf embryos injected with 30 pg vp16-hoxb5b, compared to WT controls. The POD is denoted with a white arrow head. (E–G) Quantified POD foxd3 expression area (E, control n = 7; vp16-hox5b n = 10; p = 0.00571) or phox2bb expression area (F, control n = 7; vp16-hox5b n = 8; p = 0.138), as noted in representative images by black bars. The discrete POD expression domain is quantified from these same embryos as shown in (G) (p = 0.00563). Areas are normalized to control mean. (H–K) IHC detection of Phox2b+ cells viewed along the lateral axis of 32 hpf embryos reveal that WT controls (n = 7) already have a nascent population [(H), white arrowheads]. vp16-hoxb5b overexpression, at either 15 pg [(I), n = 9] or 30 pg [(J), n = 5] of mRNA injected, expands the Phox2b+ vagal NCCs (white arrowheads). (K) Counted Phox2b+ cells from 3 dimensional micrographs reveal increasing cells with the amount of vp16-hoxb5b mRNA (15 pg: p = 3.03 × 10⁻⁵; 30 pg: p = 2.61 × 10⁻⁵). Scale bar (A,H): 100 μM. |

Temporally controlled overexpression of Hoxb5b during the first day in development is sufficient to expand the neural crest pool. (A) Schematized model of the hsp70l:gfp-hoxb5b;cryaa:dsRed genetic construct. (B) Illustration depicting specific periods of heat shock for embryo groups relative to classical hallmarks of zebrafish NCC development. (C,D) in situ hybridization using a probe for crestin in hsp70l:GFP-hoxb5b + embryos heat shocked at 14 hpf and fixed at 24 hpf, compared to GFP− sibling controls treated in parallel. Dramatic expansion of the POD can be seen (yellow arrowheads) in the Hoxb5b overexpressing embryos, while more subtle expansion is noted in the cranial NCC (white arrowheads) and pre-otic crest (red arrowheads). (E–H) Similar to (C,D) in situ hybridization with a crestin probe in hsp70l:gfp-hoxb5b and GFP- sibling controls heat shocked at 22 hpf and fixed at 26–28 hpf, examining both crestin + domains both laterally (E,F) and dorsally (G,H). (I,J) Graphs depicting areas occupied by crestin staining in both GFP- control and Hoxb5b overexpressing embryos. Hoxb5b overexpression at 14 hpf was sufficient to expand NCC localization and qualitatively NCC number [(I), control n = 6; hsp70:GFP-hoxb5b + n = 8; p = 0.0234]. A later heat shock at 22 hpf—fixation at 26–28 hpf, also expanded vagal NCC localization [(J), control n = 10; hsp70:GFP-hoxb5b + n = 14; p = 0.0398], and increased crestin staining, indicative of an increase in NCC number. Scale bars (C,E,G): 100 μM |
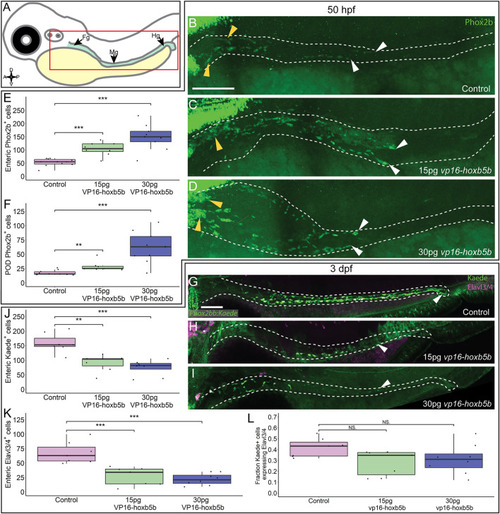
Hoxb5b is sufficient to expand early enteric neural progenitors. (A) Schematized model of a zebrafish embryo highlighting the region of the gut tube, which is imaged in the following panels. (B–D) Whole mount IHC for Phox2b in 50 hpf control embryos [(B), n = 10] compared to embryos injected either with 15 pg [(C), n = 7] or 30 pg [(D), n = 9] of vp16-hoxb5b mRNA. Yellow arrow heads indicated POD localized Phox2b+ cells, white arrows designate terminal end of enteric NCC chain, which falls within the gut tract outlined with white dashes. (E,F) Quantified cell numbers from the same animals reveal a coordinate increase in Phox2b+ along the gut axis at 50 hpf trending with increasing vp16-hoxb5b mRNA amounts [(E), 15 pg: p = 2.834 × 10⁻⁵; 30 pg: p = 0.00318]. Additionally, the number of Phox2b+ cells restricted to the POD also increased in response to elevated Hoxb5b activity [(F), 15 pg: p = 0.00328; 30 pg: p = 0.00068]. (G–I) Whole mount IHC on 3 dpf -8.3phox2bb:kaede embryos with antibodies against Elavl3/4 and Kaede, marking the enteric NCC lineage cells in vp16-hoxb5b overexpressing animals (15 pg n = 8; 30 pg n = 7) compared to uninjected sibling controls (n = 7). (J–L) Quantification of the number of enteric neural progenitors [(J), 15 pg: p = 0.00011; 30 pg: p = 4.09 × 10⁻⁵) and differentiating enteric neurons [(K), 15 pg: p = 0.001352; 30 pg: p = 0.0001042] at 3 dpf show decreasing numbers of both cell populations. However, the total fraction of differentiating (Hu+) NCC-derived Kaede+ cells unchanged following elevated Hoxb5b activity [(L), 15 pg: p = 0.0.1282; 30 pg: p = 0.102]. Scale Bar (B,G): 100 μM. |

NCC sensitivity to increased Hoxb5b activity is restricted to earlier stages of development. (A) Schematized model of when heat shocks occurred relative to standard stages of NCC development in zebrafish. (B–H) Whole mount immunolabeled hsp70l:GFP-hoxb5b + embryos and their GFP- sibling controls (HS14: n = 6, HS21: n = 6, HS48: n = 12) using an antibody against Elavl3/4. hsp70l:GFP-hoxb5b + embryos heat shocked either at 14 hpf (n = 11) or 21 hpf (n = 10) both exhibited fewer differentiating enteric neurons than controls, but not embryos heat shocked at 48 hpf (n = 14). Numbers of enteric neurons are quantified in (H, HS14: p = 0.000232; HS21: p = 0.001684; HS48: p = 0.5813). Scale Bar (B): 100 μm. |

Elevated Hoxb5b abrogates the expansion capacity of enteric NCC-derived neuronal lineage. (A,B) By 63 hpf, sox10:GFP + embryos immunolabeled for Phox2b show cells which have partially migrated along the gut in both control and vp16-hoxb5b injected animals. Gut tract outlined with white dashes. (C) No changes were found in the number of GFP+ NCC lineage or Phox2b+ cells along the gut between control embryos (n = 6) and those overexpressing vp16-hoxb5b (n = 6) (Enteric GFP+: p = 0.2619; Enteric Phox2b+: p = 0.7896). (D) Assessment of fraction of GFP+ cells which are also positive for Phox2b+ restricted to the gut axis from the same animals in (C), as a measure of NCC which have initiated their differentiation programs shows the fraction of Sox10+ lineage cells which have turned on Phox2b expression is unchanged following elevated Hoxb5b (p = 0.1253). (E) Summary of the number of Phox2b+ cells for either WT control embryos or embryos injected with 15 pg vp16-hoxb5b mRNA as a function of age from animals used throughout this study. The trend shows while the number of Phox2b+ cells initially is greater than WT, eventually the WT Phox2b+ numbers continue to increase with the Phox2b+ population in Hoxb5b elevated embryos remains flat. Error bars reflect ± one standard deviation. (F) Graphical Model of the role of Hoxb5b in NCC development, such that early Hoxb5b expression grossly expands NCC numbers, while later in development Hoxb5b suppresses NCC enteric expansion. Scale bar (A): 100 μm. |