
- Title
-
Cilia proteins are biomarkers of altered flow in the vasculature
- Authors
- Gupta, A., Thirugnanam, K., Thamilarasan, M., Mohieldin, A.M., Zedan, H.T., Prabhudesai, S., Griffin, M.R., Spearman, A.D., Pan, A., Palecek, S.P., Yalcin, H.C., Nauli, S.M., Rarick, K.R., Zennadi, R., Ramchandran, R.
- Source
- Full text @ JCI Insight

Shear stress causes brain ECs to express fewer cilia proteins in vitro. HBMVECs were subjected to graded strengths of shear stress (2 dyne/cm2, 4 dyne/cm2, and 10 dyne/cm2) by the Ibidi flow system. A total of 2 dyne/cm2 was utilized as a “steady-state” flow condition. Following flow with durations as indicated, the expression of cilia-associated proteins was quantified as MFI by flow cytometry. NRF2, the transcription factor reported to control cilia formation and function, was also included in the study. Expression of proteins in the samples was normalized against their respective “no flow” controls. ANOVA was performed to compare between the experimental groups versus steady-state control group for 10-minute or 24-hour time points. ANOVAs were 2 way. Analysis was also performed between 10 minutes and 24 hours in 2 dyne/cm2 group. In all 3 protein expressions, no statistical difference was observed between 4 dyne/cm2 and 10 dyne/cm2 groups. *P < 0.05, **P < 0.01, ***P < 0.001, ****P < 0.0001. For all groups reported in this figure, n = 6 except for IFT88 (n = 5 for 10 dyne group). |

Shear stress causes deciliation of endothelial and epithelial cells in vitro. (A–D) HUVECs grown on monolayer. Fluid shear stress of 20 dyne/cm2 was perfused onto the cells, and the perfusate was collected. The drop concentrated perfusate was analyzed with DIC microscopy and stained with markers for cilia (acetylated-α-tubulin) (B) and basal body (γ-tubulin) (C). Enlarged images are also shown in the boxes. (D) Merged image is shown. (E and F) Immunostaining (acetylated-α-tubulin, green, cilia; and DAPI, blue, nucleus) for the presence and absence of the cilia from the epithelial cell population before (upper panel) and after (lower panel) the application of 10 dyne/cm2 shear stress, respectively. (G and H) Phase contrast DIC image of a primary cilium in a single live cell (white dotted box). The same cell was imaged before and after 4-minute application of 10 dyne/cm2 fluid shear stress. (I) Perfusate under DIC microscopy. (J) A separate experiment, where perfusate was collected and stained with ciliary marker (acetylated-α-tubulin; green) to confirm the presence of cilia using both fluorescence and phase contrast imaging (I). (K) Cilia and cell lysates were immunoblotted with cilia marker (acetylated-α-tubulin) to molecularly confirm the presence of the cilia in the perfusate (n = 6). E–K represent porcine kidney epithelial cells (LLC-PK1). |
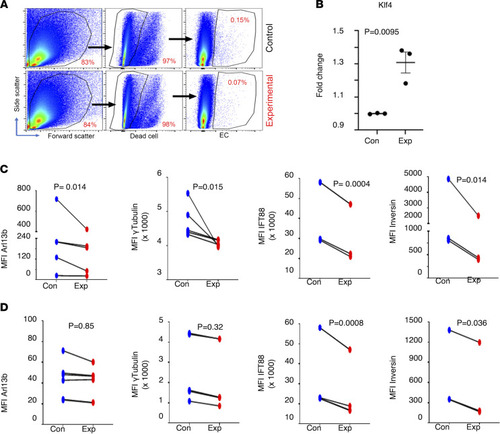
Shear stress results in ECs with fewer cilia proteins in vivo. Flk1mCherry Arl13bGFP double-transgenic zebrafish embryos at 29.5 hpf were subjected to 32°C temperature for 3 hours. Single cells were harvested from dechorionated embryos, and expression of cilia-specific proteins was quantified by flow cytometry in live ECs (mCherry+) versus non-ECs (mCherry–). Representative dot plots show the gating strategy as applied during FACS analysis to identify ECs (A). Stress-responsive protein Klf4 was quantified in ECs (B). Protein quantification was done by measuring MFI. Cilia-specific proteins were quantified in ECs (C) as well as non-ECs (D). Arl13b expression is marked by enhanced green fluorescent protein expression. For Arl13b n = 6 (for EC and non-EC); γ-tubulin n = 5 (for EC and non-EC); Ift88 n = 4 (EC) and n = 5 (non-EC); Inversin (n = 3 for EC and non-EC); Klf4 n = 3 (for EC and non-EC). A linear mixed model was used to examine the differences between treatment group and control group within EC (mCherry+) or non-EC (mCherry–). Time processed nested within day was treated as random. ARL13b and Inversin expression data were log-transformed to improve fit. |

Sickle RBCs adhere to brain ECs triggering deciliation, and cilia are found on sickle RBCs and plasma from SCD. HBMVECs exposed to sickle (SS) or healthy (AA) RBCs were subjected to shear stress (1 dyne/cm2), and fraction of SS (n = 6) and AA (n = 5) RBCs adhered to ECs after stress induction was calculated, P = 0.0081 (A). SS and AA RBCs were tested for ARL13b cilia prior to flow and proportion of ARL13b cilia adhered to circulating SS RBCs (n = 16) versus AA RBCs (n = 12) were quantified, P < 0.0001 (B). After flow, ARL13b expression on SS RBCs (n = 11), but not AA RBCs (n = 6), upon interaction with ECs, P = 0.0006 (C). (A–C) Mann-Whitney-Wilcoxon test P values are provided. Representative field (magnification 63×; scale bar = 20 μm) of a smear of SS RBCs shows cilia presence on these sickle cells, detected with FITC-conjugated anti-Arl13b antibody (D). Western blot plot shows the detection of cilia-specific proteins in plasma samples of healthy controls (AA) versus sickle (SS). Red asterisk represents the top IFT88 band that was used for quantification (E). Please note that Western blots from only 4 AA and SS samples are shown in E. A separate gel for the other 6 samples was run and quantified. Quantification includes all 10 samples from each group. Cilia-specific proteins were quantified from plasma samples of healthy controls (AA) (n = 10) versus sickle (SS) (n = 10) and normalized against housekeeping protein bACTIN (F). *P < 0.05, ***P < 0.001. A 2-tailed t test or Mann-Whitney-Wilcoxon test was performed to compare between groups. |

Cilia shedding triggered by sickle RBCs is dependent on RBC-induced increased EC ROS generation. Human brain microvascular ECs were sham treated or treated with the NOX inhibitor apocynin (A), prior to exposure or not with sickle RBCs (SS RBCs) (n = 6). Exposure of HBMVECs to SS RBCs increased ROS generation in ECs, which is dependent on NOX. Flow cytometry analysis shows ARL13b bound to SS RBCs (n = 6) prior to (baseline) and after interaction with shear-stressed ECs pretreated with apocynin (B). *P < 0.05, and ****P < 0.0001. +a = ECs treated with apocynin. For A, 1-way ANOVA test was performed, and for B, Wilcoxon’s signed-rank test was performed. |

Attenuating ROS production rescues cilia proteins in ECs. HBMVECs were treated with ROS-inducing PMA in presence or absence of NOX inhibitor VAS2870. Untreated groups were also included as controls. ROS production was quantified as MFI by flow cytometry (A). Oxidative stress counteracting protein heme oxygenase 1 (HO-1) was quantified (B). NRF2, the transcription factor reported to control cilia formation and function, was also included in the study (C). Cilia proteins are downregulated by PMA and rescued by NOX inhibitor VAS2870 (D and E). ****P < 0.0001. ANOVA (1 way) was performed, and Bonferroni’s correction was used to adjust for multiple comparisons (n = 5 for all groups). |
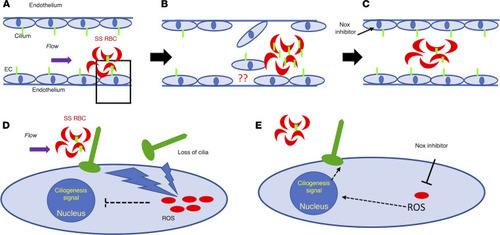
Proposed mechanism of loss of cilia proteins. The schematic demonstrates cilia stability mechanisms associated with sickle RBCs (SS RBCs) and brain ECs in an SCD setting. Green-colored structures on RBCs and ECs are cilia, and red-colored dots in (D and E) are oxidative stress components, such as ROS. SS RBCs create altered shear stress on ECs due to their sickle shape. Upon interaction with ECs, SS RBCs elevate endothelial oxidative stress (A and D). The physical (shear) or metabolic (oxidative) stress results in loss of endothelial cilia or cilia-associated proteins. These shredded cilia fragments (and associated proteins) are now available for interaction with SS RBCs and may enrich the RBCs’ surface (B). Upon attenuation of oxidative stress in ECs (NOX inhibitor), the loss of endothelial cilia or any subsequent enrichment of cilia in sickle RBCs is minimized (C, fewer green cilia in RBC compared with in B). (D and E) Magnified images of A, which details the mechanism identified in this study. Sickle RBCs upon adhering to ECs elevate oxidative stress (increased ROS) in ECs (D). This causes loss of cilia or cilia-associated protein and may send inhibitory signals to the nucleus to prevent a ciliogenesis signal. Once the oxidative stress is attenuated by NOX inhibition, ROS is downregulated, and restoration of endothelial cilia is observed (E). |