
- Title
-
Osteoblasts pattern endothelium and somatosensory axons during zebrafish caudal fin organogenesis
- Authors
- Bump, R.G., Goo, C.E.A., Horton, E.C., Rasmussen, J.P.
- Source
- Full text @ Development
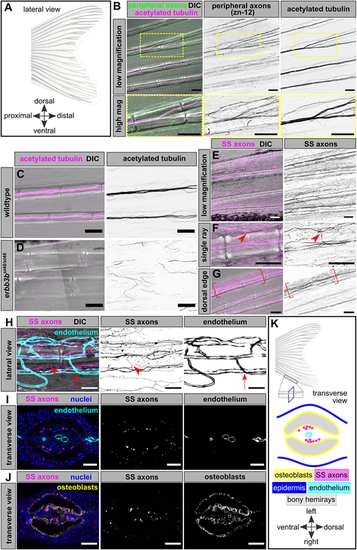
Somatosensory innervation of the adult caudal fin. (A) Schematic of the adult zebrafish caudal fin anatomy, composed of 18 bony rays. Distal (posterior) is to the right in this and subsequent lateral views. (B) Lateral view of adult caudal fin, fixed and immunostained for peripheral axons (zn-12 antibody) and acetylated tubulin. Insets show high-magnification images of a ray bifurcation. Note that zn-12 preferentially stains axon endings, whereas acetylated tubulin preferentially labels axon bundles. (C,D) Representative images of caudal fin bony rays (DIC) and acetylated tubulin staining in adult fins of the indicated genotypes. (E-G) Caudal fin bony rays (DIC) and somatosensory axons (SS axons) of an adult Tg(p2rx3a>mCherry) fish. Arrowheads in F illustrate an axon branching to exit the ray segment. Note the increased density of somatosensory axons at the dorsal-most fin edge in G as indicated by the brackets. (H) Single caudal fin bony ray (DIC), somatosensory axons (SS axons) and endothelium of an adult Tg(p2rx3a>mCherry);Tg(fli1a:EGFP) fish. Arrowheads denote a SS axon entering or exiting the bony ray, not associated with endothelial exit points (arrows mark one such example). (I) Transverse cross-section of a single bony ray of an adult Tg(p2rx3a>mCherry);Tg(fli1a:EGFP) fish. Note the lack of apparent association between axons and endothelium within the intra-ray space. (J) Transverse cross-section of a single bony ray of an adult Tg(p2rx3a>mCherry) fish, immunostained with the zns-5 antibody to label osteoblasts. Note the close juxtaposition of axons and intra-ray osteoblasts. (K) Schematic illustrating the anatomy of a transverse view of a single bony ray based on our results. Scale bars: 100 μm (B-G); 50 μm (H); 25 μm (I,J). |
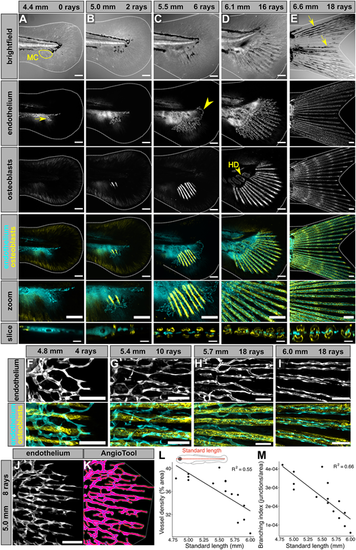
Stages of endothelial outgrowth, plexus formation, and remodeling during caudal fin development. (A-E) Lateral views of confocal projections of caudal fins fixed at the indicated stages expressing transgenic markers for osteoblasts [Tg(sp7:mCherry-NTR)] and endothelium [Tg(fli1a:EGFP)]. Dotted lines denote caudal fin margins. ‘Zoom’ panels show cropped, enlarged regions of merged images. ‘Slice’ panels represent reconstructed orthogonal views of the developing plexus and ray-associated osteoblasts. The yellow arrow in A indicates the ventral endothelial sprout. The yellow outline in A indicates the mesenchymal condensation (MC), visible under brightfield. The yellow arrowhead in C indicates the dorsal endothelial loop. The yellow arrowhead in D indicates the hypural diastema (HD), the future location between hypurals 2 and 3. The yellow arrows in E point to examples of melanophores tracking along bony rays. (F-I) Confocal projections of osteoblasts [Tg(sp7:mCherry-NTR)] and endothelium [Tg(fli1a:EGFP)], capturing endothelial remodeling around the osteoblasts at the indicated stages. Note that the initially disorganized, web-like plexus progressively remodels to its mature linear, ray-aligned morphology. (J,K) Example of an endothelial [Tg(fli1a:EGFP)] image (J), segmented and analyzed in AngioTool (K). Blue dots denote branchpoints. (L,M) Quantification of density and branching of the caudal fin endothelium relative to standard length. Scale bars: 100 μm (A-E); 20 μm (A-E, slice panels); 50 μm (F-J). |

Timing of DRG ray innervation and maturation during caudal fin development. (A-E) Confocal projections of caudal fins fixed at the indicated stages expressing transgenic markers for osteoblasts [Tg(sp7:mCherry-NTR)] and endothelium [Tg(fli1a:EGFP)] and immunostained for axons (acetylated tubulin antibody). ‘Zoom’ images are cropped, enlarged regions of merged images. Dotted lines denote caudal fin margins. The yellow arrowhead in C denotes the future position of the hypural diastema (HD). New rays are added symmetrically on either side of the HD. Double-headed arrows in the inset in C denote the bilateral, symmetrical pattern of innervation. Note the axons on the inner surface of each hemiray in the slice panel. The yellow arrows in D denote that the dorsal-most and ventral-most ray-associated axons originate along separate routes than the inner ray-associated axons. White arrowheads indicate the position of lateral line (LL) axons growing into the caudal fin in the inter-ray space. (F,G) Quantification of the number of innervated bony rays versus standard length (F) and notochord flexion angle (G). (H) Schematic illustrating the three posterior ganglia of the developing trunk, with DRG(0) (magenta) demarcating the most posterior cluster, DRG(−1) marking the second most posterior cluster (purple) and DRG(−2) marking the third most posterior cluster (blue). (I,J) Confocal projections of fish expressing neural crest lineage [sox10: Tg(Mmu.Sox10-Mmu.Fos:Cre);Tg(actb2:LOXP-BFP-LOXP-DsRed)] and sensory channel [TgBAC(trpa1b:EGFP)] reporters. Arrowheads indicate DRGs color-coded as in H. Arrows indicate trpa1b+ DRG soma. (K) Scatterplots with linear regression lines showing quantification of trpa1b+ soma (arrows in J) in each of the three posterior-most ganglia relative to standard length. Scale bars: 200 μm (A-E); 10 μm (inset in C); 50 μm (A-E zoom panels; I,J). |
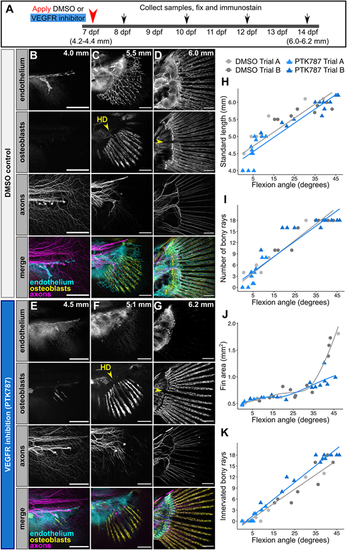
Caudal fin bony ray development and innervation progress in the absence of endothelium. (A) Diagram illustrating experimental scheme of VEGFR inhibition in developing zebrafish. (B-G) Confocal projections of fins expressing reporters for osteoblasts [Tg(sp7:mCherry-NTR)] and endothelium [Tg(fli1a:EGFP)] and immunostained for axons (acetylated tubulin antibody). Treatments and stages as indicated. Yellow arrowhead denotes the future position of the hypural diastema (HD). Note that despite the severe reduction in endothelial growth into the fin following PTK787 treatment, early osteoblast and axon patterning appear unperturbed. (H-K) Quantification of developmental metrics and ray innervation between treatment groups. Lines represent linear regression (H,I,K) or local polynomial smoothing (J). SL/flexion angle slope between the two independent trials of DMSO control fish and PTK-treated fish was not significantly different (P=0.158; ANCOVA). Number of bony rays/flexion angle slope between the two independent trials of DMSO control fish and PTK treated fish was not significantly different (P=0.913; ANCOVA). Number of innervated rays/flexion angle slope between the two independent trials of DMSO control fish and PTK treated fish was significantly different above a flexion angle of 13.06 degrees (P<0.05; Johnson–Neyman technique). For H,I,K, a total of n=24 PTK787-treated (mean SL=5.14±0.74 s.d.) and n=18 DMSO-treated fish (mean SL=5.28±0.73 s.d.) are plotted. For J, a total of n=18 PTK787-treated (mean SL=5.49±0.58 s.d.) and n=17 DMSO-treated fish (mean SL=5.72±0.61 s.d.) are plotted. Data are representative of at least three biological replicates. Scale bars: 100 μm (B-G). |
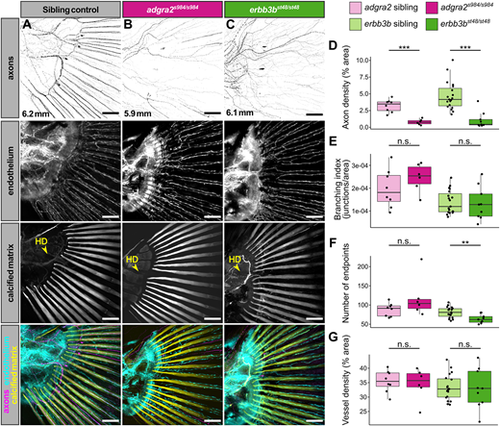
Innervation of the caudal fin bony rays by DRG axons is not required for caudal fin ray and endothelial patterning. (A-C) Representative confocal projections of caudal fins from the indicated genotypes expressing the endothelial marker Tg(fli1a:EGFP) fixed at the indicated stages and stained for axons (acetylated tubulin antibody) and calcified matrix (Alizarin Red S). Note the lack of ray-associated axons in the adgra2 and erbb3b mutants. Yellow arrowheads indicate the hypural diastema (HD). (D-G) Box plots of axon density, branching index, number of endpoints, and vessel density for fins of the indicated genotypes. Wilcoxon rank sum test between adgra2 siblings and adgra2 mutants (axon density, P=0.000666; branching index, P=0.345; number of endpoints, P=0.1551; vessel density, P=0.8518). adgra2 sibling fish, n=8 (mean SL=6.01 mm±0.11 s.d.). adgra2 mutant fish, n=6 (mean SL=6.0 mm±0.48 s.d.). Wilcoxon rank sum test between erbb3b siblings and erbb3b mutants (axon density, P=2.809e−05; branching index, P=0.6993; number of endpoints, P=0.004654; vessel density, P=0.9615) erbb3b sibling fish, n=19 (mean SL=6.34 mm±0.29 s.d.). erbb3b mutant fish, n=9 (mean SL=6.89 mm±0.45 s.d.). **P<0.01, ***P<0.001. n.s., non-significant. Data are representative of at least two biological replicates. Scale bars: 100 μm (A-C). |
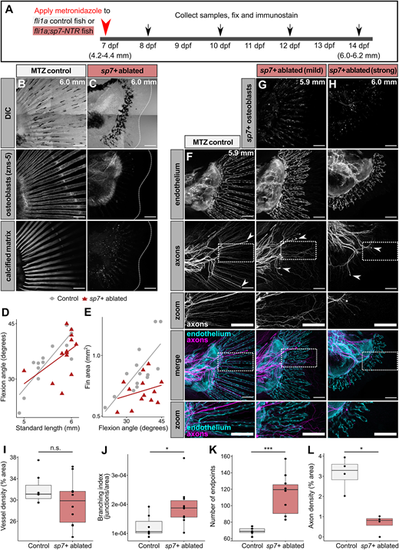
Osteoblasts are required for endothelial remodeling and axon patterning in the developing caudal fin. (A) Diagram illustrating experimental scheme of sp7+ osteoblast ablation in developing zebrafish. (B,C) Representative confocal projections of MTZ-treated control [Tg(fli1a:EGFP)] or osteoblast-ablated [Tg(fli1a:EGFP);Tg(sp7:mCherry-NTR)] caudal fins fixed at the indicated stages and stained for markers of osteoblasts (zns-5 antibody) and calcified matrix Alizarin Red S. Dotted lines denote caudal fin margins. Note the lack of zns-5+ osteoblasts and calcified matrix within the osteoblast ablated fin. (D,E) Developmental metrics in control and sp7+-ablated fins. Control fli1a+ fish, n=14. sp7+ ablated fish, n=13. SL/flexion slope between genotypes was not significantly different (P=0.154; ANCOVA). Flexion/fin area between genotypes was significantly different (P=0.00102; ANCOVA). Representative results from a single independent trial. (F-H) Representative confocal projections of MTZ-treated control [Tg(fli1a:EGFP)] or osteoblast-ablated [Tg(fli1a:EGFP);Tg(sp7:mCherry-NTR)] caudal fins fixed at the indicated stages and stained for axons (acetylated tubulin antibody). White arrowheads indicate lateral line (LL) axons. Note the disorganized appearance of axons and endothelium in the absence of sp7+ osteoblasts. ‘Zoom’ panels show high-magnification images of the boxed areas above. (I-K) Box plots of vessel density, branching index and number of endpoints between treatment groups. Wilcoxon rank sum test results: vessel density, P=0.31; branching index, P=0.033; number of endpoints, P=0.00074. Control fli1a+ fish, n=7 (mean SL=5.96 mm±0.05 s.d.). sp7+ ablated fish, n=10 (mean SL=5.87 mm±0.15 s.d.). Representative results from a single independent trial. (L) Box plot of axon density between control and osteoblast-ablated groups. Wilcoxon rank sum test between groups, P=0.02857. Control fli1a+ fish, n=4 (mean SL=5.9 mm±0.00 s.d.). sp7+ ablated fish, n=4 (mean SL=5.93 mm±0.09 s.d.). *P<0.05, ***P<0.001. n.s., non-significant. Data are representative of at least two biological replicates. Scale bars: 100 μm (B,C,F-H). |
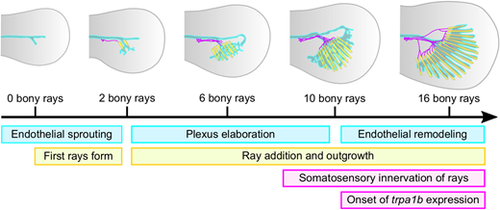
Summary of caudal fin ray, endothelium and axon development. Schematic illustrating the sequential cellular events between caudal fin rays (yellow), endothelium (cyan) and somatosensory peripheral axons (magenta) during caudal fin development described in this study. |