
- Title
-
CRISPR-Cas9 induces large structural variants at on-target and off-target sites in vivo that segregate across generations
- Authors
- Höijer, I., Emmanouilidou, A., Östlund, R., van Schendel, R., Bozorgpana, S., Tijsterman, M., Feuk, L., Gyllensten, U., den Hoed, M., Ameur, A.
- Source
- Full text @ Nat. Commun.

The diagrams show Cas9 cleavage sites detected in vitro by Nano-OTS for the four gRNAs targeting ldlra, nbeal2, sh2b3, and ywhaqa. The sequence at the top of each diagram displays the gRNA sequence and PAM site (NGG). The rows below show the on-target site as well as the identified off-target sites. Colored letters correspond to single-nucleotide mismatches between the target site and the GRCz11 genome. Triangles are used to mark insertion mismatches, where nucleotides need to be inserted to match the reference genome. Asterisks and circles mark off-target sites located within exonic and intronic regions, respectively. The column to the right shows the number of reads in the Nano-OTS analysis for each target site. |

Genome editing was performed in fertilized eggs by microinjection of ribonucleoprotein (RNP) at the single-cell stage. The genome editing experiment results in mosaic heterozygous mutants, mosaic homozygous mutants, or unaffected homozygotes (together referred to as founders). A number of F0 embryos were not injected and used as controls. F1 generation zebrafish were generated by in-crossing randomly selected pairs of adult founders. The offspring of these crossings have stable genotypes with 0 (−/−), 1 (+/−) or 2 (+/+) mutated alleles. Samples were collected for analysis at different stages of the experiment as described in the gray box. |
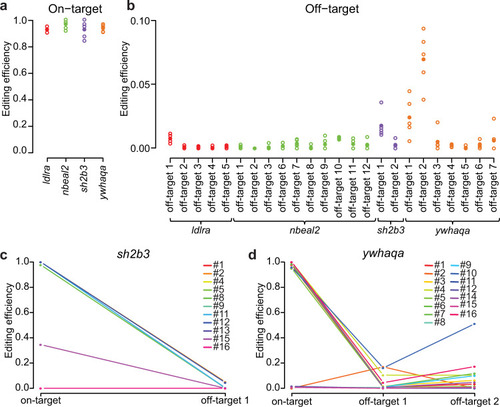
a On-target CRISPR-Cas9 editing efficiencies in pools of founder larvae for the four gRNAs ldlra, nbeal2, sh2b3, and ywhaqa. Each circle corresponds to the editing efficiency in a specific larvae pool, and the average values are indicated by solid circles. b Off-target CRISPR-Cas9 editing efficiencies in pools of founder larvae. c, d Line graphs visualizing the CRISPR-Cas9 editing efficiencies at on- and off-target sites in individual adult founders. Each colored line shows the editing efficiencies at the on- and off-target site(s) in one individual. Source data are provided as a Source Data file. |

Schematic view of sequencing reads and editing events at the on-target sites for sh2b3 and ywhaqa, produced by the SIQ software. In each plot, the y-axis displays the fraction of different editing events, and the x-axis their genomic positions. The zero coordinate indicates the Cas9-cleavage site for sh2b3 and ywhaqa. Control samples from uninjected zebrafish displaying the sh2b3 (a) and ywhaqa (b) targeted sites. Only wild-type alleles and sequences containing SNVs are detected in these controls. SIQ results from three individual F0 founder fish edited for sh2b3 (c) or ywhaqa (d). In the CRISPR-Cas9 edited F0 individuals, a large number of distinct insertions, deletions, as well as combinations of insertions and deletions are reported. This indicates a high degree of somatic mosaicism of CRISPR-Cas9 editing events in the F0 individuals. Source data are provided as a Source Data file. |

a A dot plot showing the size distribution of Cas9-induced on-target mutation events (large and small insertions and deletions) in pools of founder larvae. Each point in the graph visualizes a specific event in a sample, where the x-axis displays the size of the variant (negative values for deletions and positive values for insertions), and the y-axis displays the frequency of the variant in the individual sample. b Fractions of small and large insertions and deletions at on-target sites in pools of founder larvae. c Zoomed-in view of the plot in (a), only visualizing small insertions and deletions. d Size distribution of Cas9-induced off-target mutations (sh2b3 off-target 1, ywhaqa off-target 1 and 2) in pools of founder larvae. e Fractions of small and large insertions and deletions at the three off-target sites in pools of founder larvae. f Zoomed-in view of the plot in d), only visualizing small insertions and deletions. g An example of an adult founder fish with a 903 bp deletion at ywhaqa’s off-target 2 that spans an entire exon of ywhaqb. The coverage plot shows the number of reads with the 903 bp deletion and the number of reads that lack the deletion (i.e., unmodified and other Cas9-induced variants). The Cas9 cleavage site is indicated by the dashed red line. Source data are provided as a Source Data file. |

The frequencies of Cas9-induced variants in all analyzed samples for the F0 and F1 generations are displayed in the summary plots (a–d). Each point represents one sample (i.e., a pool of larvae or an individual juvenile/adult fish). a The total frequencies of Cas9-induced variants at on-target sites. b The frequencies of SVs induced by Cas9 at on-target sites. c The total frequencies of Cas9-induced variants at off-target sites (sh2b3 off-target 1, ywhaqa off-targets 1 and 2). d The frequencies of SVs induced by Cas9 at off-target sites. Source data are provided as a Source Data file. |

Examples of large SVs at on-target sites in individual juvenile F1 zebrafish, a 1053 bp deletion in sh2b3 (a) and a 292 bp insertion in ywhaqa (b). c, d The same variants are observed in pools of F1 larvae from the same F0 pair as the individuals in (a) and (b). The plots show the number of reads with the large SV and the reads without the variant (i.e., unmodified and other Cas9-induced variants). The Cas9 cleavage sites are indicated by the dashed red lines. |