
- Title
-
Phenotyping Zebrafish Mutant Models to Assess Candidate Genes Associated with Aortic Aneurysm
- Authors
- Prendergast, A., Ziganshin, B.A., Papanikolaou, D., Zafar, M.A., Nicoli, S., Mukherjee, S., Elefteriades, J.A.
- Source
- Full text @ Genes (Basel)
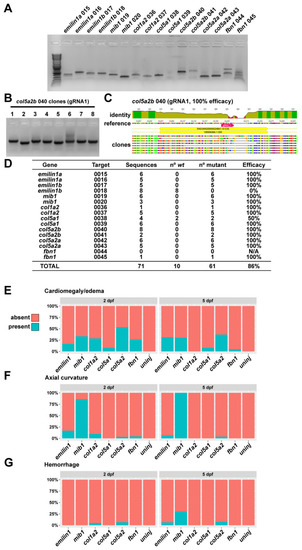
Quantification of phenotypes and gRNA efficacy. (A) Amplicons for each gRNA target were generated by PCR and then TOPO-cloned to generate a library of targeted genomic DNA sequences. (B) Individual clones were amplified by colony PCR and sent for sequencing. (C) Sequences were aligned to wt to determine the incidence of indel mutations. (D) For most targets, we are unable to isolate wt DNA by cloning, indicating a very high degree of mutational efficiency (with the exception of emilin1b gRNA 2, which appears to be non-functional). (E) Quantification of cardiomegaly phenotypes for all genes at 2 and 5 dpf. (F) Quantification of axial curvature defects for all genes at 2 and 5 dpf. (G) Quantification of hemorrhage defects for all genes at 2 and 5 dpf. |
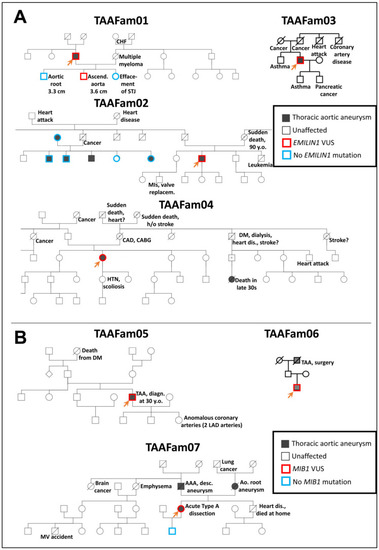
Pedigrees of EMILIN1 (Panel A) and MIB1 (Panel B) families with thoracic aortic disease tested as part of routine clinical genetic testing at the Yale Aortic Institute. For testing EMILIN1 variants in the zebrafish model, missense variants identified in TAAFam02 and TAAFam03 were used (p.E170G and p.T904S, respectively). For testing MIB1 variants in the zebrafish model, nonsense variants identified in TAAFam05, TAAFam06, TAAFam07 were used (p.R906X seen both in TAAFam05 and TAAFam06 and p. G596X for TAAFam07). The index patients (labeled with an arrow) underwent exome sequencing, while other family members underwent single-site Sanger sequencing. |
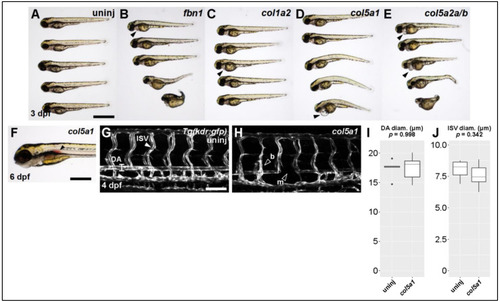
Knocking out Ehlers-Danlos and Marfan Syndrome-related genes generates vascular phenotypes. (A) Brightfield macroscopic image of representative series of uninjected larvae at 3 dpf. Scale bar: 1 mm. (B) Similar image of fbn1 knockout fish. Filled arrowhead indicates cardiomegaly. (C) Similar image of col1a2 knockout fish. (D) Similar image of col5a1 knockout fish. (E) Similar image of col5a2a/b knockout fish. (F) Closeup brightfield image of a 6 dpf col5a1 knockout fish with visible aortic hemorrhage (filled arrowhead, scale bar: 500 µm). (G) Confocal micrograph of trunk vasculature of a 4 dpf uninjected Tg(kdr:gfp) fish. DA: dorsal aorta, ISV: intersegmental vessel. Scale bar: 100 µm. (H) Similar micrograph of a col5a1 knockout fish. Empty arrowheads indicate b: excessively branching segment and m: missing segments. (I) Quantification of DA diameter. Diameter is not significantly changed across conditions (t-test, p = 0.998). (J) Quantification of ISV diameter. Diameter is not significantly changed across conditions (t-test, p = 0.342). PHENOTYPE:
|
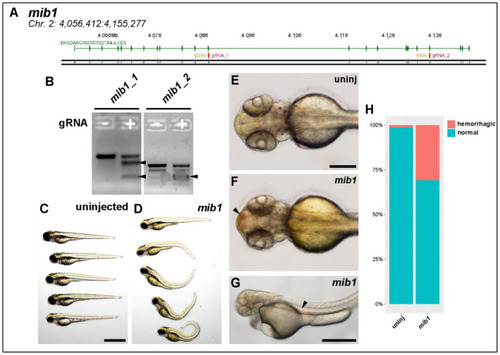
Knocking out mib1 generates a hemorrhagic phenotype. (A) Genomic region of chromosome 2 containing mib1 gene. Two patient mutations G596 and R906 are indicated. gRNAs (magenta) were designed to target both regions. (B) T7 endonuclease activity against gRNA target amplicons. Uninjected DNA pool (−) produces one fragmentation pattern, mib1-injected DNA pool (+) produces extra bands (filled arrowheads) caused by heteroduplex DNA formation due to editing and subsequent digestion by T7 endonuclease. (C) Brightfield macroscopic image of representative series of uninjected larvae at 3 dpf. Scale bar: 1 mm. (D) Similar image of mib1 knockout fish. Note severe body curvature defects. (E) Uninjected 54 hpf fish, dorsal view. Scale bar: 250 µm. (F) Similar mib1 knockout fish exhibiting cranial hemorrhage (filled arrowhead). (G) Brightfield image of 50 hpf mib1 knockout fish with aortic hemorrhage (filled arrowhead, scale bar: 500 µm). (H) Quantification of hemorrhagic phenotype. Mib1 knockout fish exhibit significantly more hemorrhagic events (uninj: 1%, mib1: 31%, chi-square test, p < 0.001). PHENOTYPE:
|
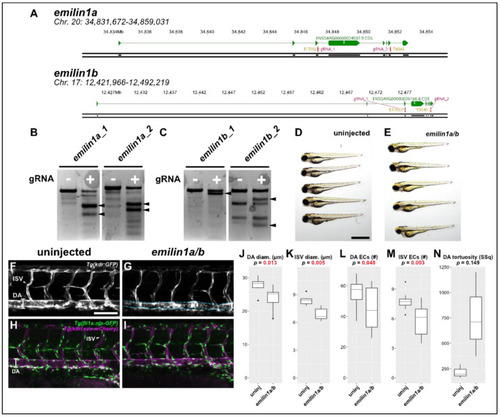
Knocking out emilin1a/b reduces DA and ISV diameter, endothelial cell counts. (A) Genomic region of chromosomes 20 and 17 containing emilin1a and b, respectively. Patient mutations E170G and T904S are indicated and their corresponding gRNAs are overlaid (magenta). (B) T7 endonuclease activity against gRNA target amplicons for emilin1a. Supernumerary bands are generated for both injected gRNAs (filled arrowheads). (C) Similar T7 assay as (B), but applied to emilin1b target amplicons. (D) Brightfield macroscopic image of a representative series of uninjected 3 dpf larvae. Scale bar: 1 mm. (E) Similar image of emilin1a/b fish. Note that fish are generally normal in appearance. (F) Confocal micrograph of uninjected 3 dpf Tg(kdr:gfp) trunk vasculature. DA: dorsal aorta, ISV: intersegmental vessel, scale bar: 100 µm. (G) Similar micrograph taken of an emilin1a/b knockout fish. DA is traced in blue to emphasize tortuosity. Note the generally lower diameter of vessels, (H) Uninjected 3 dpf Tg(fli1a:nls-gfp); Tg(kdrl:ras-mcherry) trunk vasculature. DA: dorsal aorta, ISV: intersegmental vessel. Endothelial cell nuclei are labelled with GFP, making quantification possible. (I) Similar micrograph taken from an emilin1a/b knockout fish. These parameters are qualified in the following five panels: (J) DA diameter, (K) ISV diameter, (L) DA endothelial cell count, (M) ISV endothelial cell count, (N) DA tortuosity. With the exception of (N) all parameters are significant as indicated (t-test). PHENOTYPE:
|