
- Title
-
Variants in LSM7 impair LSM complexes assembly, neurodevelopment in zebrafish and may be associated with an ultra-rare neurological disease
- Authors
- Derksen, A., Shih, H.Y., Forget, D., Darbelli, L., Tran, L.T., Poitras, C., Guerrero, K., Tharun, S., Alkuraya, F.S., Kurdi, W.I., Nguyen, C.E., Laberge, A.M., Si, Y., Gauthier, M.S., Bonkowsky, J.L., Coulombe, B., Bernard, G.
- Source
- Full text @ HGG Adv

MRI characteristics of individual 1 Brain MRI of individual 1 at 17 months (A–C) and 35 months of age (D–F). (A) and (D) Sagittal T1-weighted images at the midline showing cerebellar hypoplasia (thin arrows). (B, C, E, and F) Axial T2-weighted images at the level of the basal ganglia (B and E) and centrum semiovale (C and F) showing progressive diffuse demyelination (dotted arrow). |

Biallelic variants in LSM7 (A) Genomic organization of LSM7 in humans (UCSC Genome Browser hg19) with the position of the pathogenic variants within the LSM7 gDNA indicated. (B) Major motifs of the 103 amino acid LSM7 protein with position of variants indicated. (C) LSM7 variants in affected individuals are at conserved amino acid residues. (D) LSM7 gene sequencing of affected individual 1 and parents. (E and F) 3D representations (created with PyMOL) of yeast (E) Lsm1-7 and (F) Lsm2-8 complexes displaying location of variants. |

Figure 3. LSM7 mRNA and protein levels are decreased in individual 1 compared to control individuals (A) RT-qPCR analysis of LSM7 mRNA extracted from individual 1’s fibroblasts and two age- and sex-matched control individuals (n = 6). The results are represented in terms of fold change after normalizing to RPL30 and SDHA mRNAs. Each value represents the mean ± SEM (unpaired t test [two tailed] ∗∗p < 0.01). (B) Total protein lysates extracted from individual 1 and age- and sex-matched control individual fibroblasts were immunoblotted with anti-LSM7 and anti-beta-tubulin. (C) The pixel densities of immunoblot bands from at least 3 independent replicates were quantified using ImageJ software, normalized over beta-tubulin immunoblot and represented as mean ± SEM (unpaired t test [two tailed], ∗∗∗p < 0.001). |

Impact of LSM7 variants on LSM1-7 and LSM2-8 complex assembly (A and B) Volcano plots of the log2-transformed MaxQuant ratios of the p.Asp41Asn or p.Arg69Pro/wild-type (x axis) and the −log10-transformed p values (adjusted with permutation-based false discovery rate) resulting from the two-tailed two-sample Student’s t tests. (C) Heatmap contains the MaxQuant ratios for the subunits of the LSM complexes and known important complex interactors. |
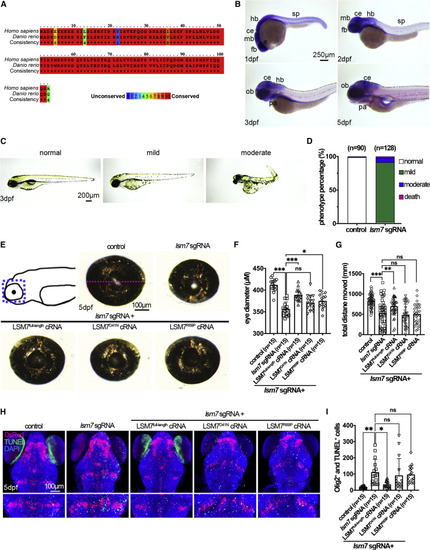
The zebrafish Lsm7 ortholog is highly conserved with human LSM7, is expressed in developing nervous system, and is necessary for embryonic morphology, eye size, motor behavior, and survival of oligodendrocytes (A) Amino acid alignment of human and zebrafish LSM7 sequences. Identical residues are marked by red boxes, and percent similarity is shown by different colors. (B) In situ hybridization was performed for detecting lsm7 expression during zebrafish embryogenesis. Embryo stages are shown in the bottom left of each panel. All panels display the lateral view, with dorsal to the top and rostral to the left. (C) Phenotypes of lsm7-Crispants. (D) Quantification of control and lsm7-Crispants by phenotype severity. (E) Top left panel shows a cartoon representation of the dissected region of larvae (blue dashed line rectangle). Images of eyes of control, lsm7-Crispant, LSM7full-length cRNA-, LSM7R69P cRNA-, and LSM7D41N cRNA-rescued larvae are shown. The eye diameter was measured as indicated by the magenta dashed line shown on control eye. (F) Quantification of eye size. (G) Motor swimming behavior of the control, lsm7-Crispant, LSM7full-length cRNA-, LSM7R69P cRNA-, and LSM7D41N cRNA-rescued larvae at 7 dpf. (H) Confocal images of dorsal view of the control, lsm7-Crispant, LSM7full-length cRNA-, LSM7R69P cRNA-, and LSM7D41N cRNA-rescued larvae with rostral to the top. Lower panels are enlarged region from upper panels for apoptotic cell quantification. (I) Quantification of the number of TUNEL and DsRed double-positive cells of (H). Abbreviations: ce, cerebellum; dpf, days post-fertilization; fb, forebrain; hb, hindbrain; mb, midbrain; ob, olfactory bulb; pa, pharyngeal arches; sp, spinal cord. ∗p < 0.05; ∗∗p < 0.01; ∗∗∗p < 0.001; n.s., not significant. |