
- Title
-
Evaluation of CRISPR gene-editing tools in zebrafish
- Authors
- Uribe-Salazar, J.M., Kaya, G., Sekar, A., Weyenberg, K., Ingamells, C., Dennis, M.Y.
- Source
- Full text @ BMC Genomics
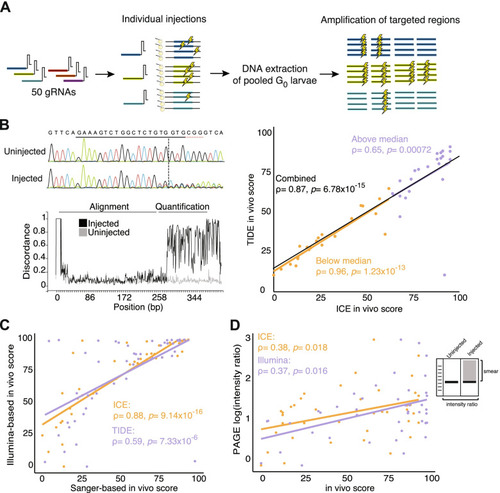
Workflow for the evaluation of CRISPR cleavages in NHGRI-1 zebrafish embryos. A The cartoon depicts our experiment, which included 50 gRNAs individually microinjected into one-cell stage embryos, DNA extracted from 20 pooled G0 larvae, and genomic regions targeted by the gRNA amplified. Lightning symbols represent a cleavage event. B An in vivo score was obtained from the Sanger sequencing traces using the ICE and TIDE tools, with an example output from ICE pictured. Scores for the two tools were plotted with values below the median in orange and above the median in purple. C Scores from ICE and TIDE tools were compared to mosaicism percentages from Illumina sequencing of the same regions. D From PAGE, an empirical intensity ratio was obtained and compared to the in vivo scores from Illumina and Sanger sequencing (ICE). Spearman correlation results are shown in the scatter plots with the line of best fit included |

Correlation of on-target efficiencies calculated using different methods. A Heatmap of the efficiency scores obtained from the design tool (CRISPRScan), in silico prediction tools, and cutting cleavages obtained in vivo using Illumina sequencing and a deconvolution tool from Sanger sequencing [35] for 50 gRNAs. Each box represents a gRNA and the efficiency scores range from 0 (blue) to 100 (red). B Spearman correlations between all efficiency scores from in silico predictions, an in vitro protocol [28], and in vivo cutting assays. Each box includes the correlation result with the p-value in parenthesis. The color of the boxes represent the correlation values, ranging between − 1 (blue) and 1 (red). CHOPCHOP scores were obtained using two different scoring methods, CHOPCHOP (D) (based on [39]) and CHOPCHOP (X) (based on [40]) |

Assessment of off-target cleavage events using different prediction methods. A The number of predicted CRISPRScan off-target sites correlated with the number of identified CIRCLE-seq sites (Spearman correlation). Log normalization was used to reduce the range in the number of sites. B In vivo editing scores from the ICE tool for the top predicted off-target sites using CRISPRScan and CIRCLE-seq were not different. Scores were compared using a Mann-Whitney U test. C Editing efficiencies at predicted off-target sites using in vivo scores from Sanger sequencing and mosaicism percentages from Illumina sequencing were correlated (Spearman correlation). D Editing scores obtained in vivo at off-target sites were not correlated with the on-target efficiency of the gRNA. All scatter plots include the Spearman correlations results with the line of best fit |

Evaluation of spurious genomic mutations in CRISPR-injection controls. A The abundance of protein-coding genes carrying frameshift variants for each Cas9-injected treatment are depicted in a Venn diagram, with mutated genes identified in both treatments listed. B Genomic DNA from zebrafish larvae injected with Cas9 enzyme, Cas9 mRNA, catalytically dead Cas9 (dCas9), a scrambled gRNA, uninjected batch siblings, and a fin clip from their parents was used to perform targeted Illumina sequencing of 21 genes to quantify indel mosaicism with average ± standard deviation values listed in the table (see Supplementary Tables 1 and 7 for the description of the genes) |

Evaluation of expression variability in CRISPR-injection controls. A Principal components analysis using the transcript abundances in larvae injected with Cas9 enzyme (Enz1, Enz2, Enz3), Cas9 mRNA (RNA1, RNA2, RNA3), uninjected siblings (Uni1, Uni2), and uninjected siblings from a different batch (Uni3, Uni4, Uni5). B Volcano plots show the differentially-expressed genes in Cas9-enzyme and Cas9-mRNA injected larvae with the number (and %) of upregulated (fold change > 1) and downregulated (fold change < − 1) genes. The top five representative up- and downregulated genes are highlighted, with the full list of genes available as Supplementary Table 6. C Differentially-expressed genes across samples injected with Cas9 enzyme or Cas9 mRNA relative to uninjected batch-siblings show significant correlations. Plots include the numbers and percentages (in parentheses) of genes downregulated (blue) and upregulated (red) in both Cas9 treatments from the total amount of genes assayed (n = 30,258) |