
- Title
-
M-CSFR/CSF1R signaling regulates myeloid fates in zebrafish via distinct action of its receptors and ligands
- Authors
- Hason, M., Mikulasova, T., Machonova, O., Pombinho, A.R., van Ham, T.J., Irion, U., Nüsslein-Volhard, C., Bartunek, P., Svoboda, O.
- Source
- Full text @ Blood Adv

csf1ra and csf1rb have distinct expression patterns in zebrafish. (A) Coexpression of csf1ra (red) and mpeg1 (green) visualized in 72 hpf Tg(fms:GAL4;UAS:mCherry);Tg(mpeg1:EGFP) triple transgenic embryos: (Aa) whole embryo, (Ab) head, (Ac) caudal hematopoietic tissue (CHT) region. (B) HCR WISH of 72 hpf embryos for csf1rb (red) and mpeg1 (green). (Ba) whole embryo, (Bb) head, (Bc) CHT region. Fluorescence images were taken on Dragonfly 503 microscope (Andor) using Zyla-4.2 sCMOS camera with magnification ×10 and processed with the Fusion software, FIJI, and Adobe Photoshop. (C) qRT-PCR analysis of pooled zebrafish embryos showing the expression dynamics of csf1ra and csf1rb in zebrafish development. Pool of 15 to 20 embryos per sample in 2 to 6 biological replicates. The expression was normalized to mob4 gene and to the time point with the highest expression (14 dpf for csf1ra and 7 dpf for csfrb). (D) qRT-PCR analysis of adult zebrafish tissues. Pool of 3 to 5 fish organs per sample in 3 to 5 biological replicates. The expression was normalized to ef1α gene. (E) scRNA-seq data showing the expression of csf1ra and csf1rb in whole kidney marrow (WKM) cell populations (pool of 2 to 3 WKMs per sample). BC, B-cells; BP, blood progenitors; E, erythroid cells; EC, endothelial cells; EP, erythroid progenitors; G, granulocytes; KSC, kidney support cells; M/M, monocytes & macrophages; MP, myeloid progenitors; NKC, NK cells; T, thrombocytes; TC, T-cells. |

csf1a, but not csf1b, and il34 drive the expansion of embryonic macrophages in vivo. (A-B) csf1a, csf1b, and il34 ligands were overexpressed by mRNA microinjection in 1-cell stage transgenic wild type (WT) embryos. Control embryos were injected with phosphate-buffered saline (PBS). Fluorescence images were acquired at 72 hpf and the area of fluorescent cells was calculated in the caudal hematopoietic tissue (CHT) (area inside of the red box) by FIJI. Results were normalized to injected controls. Scatter plots on the right represent quantification of fluorescent cells in CHT. Each dot in the scatter plot represents 1 larva. (A) Tg(fms:GAL4;UAS:mCherry); control n = 28, + csf1a n = 35, + csf1b n = 35, + il34 n = 28. (B) Tg(mpeg1:EGFP); control n = 41, + csf1a n = 45, + csf1b n = 37, + il34 n = 34. (C) WISH of 48 hpf embryos showing the expression of lcp1 in WT, 2 csf1ra mutants: csf1raV614M (panther) and csf1raΔ5bp, and in csf1ains2bp, csf1bΔ2bp ligand mutants. WT n = 15 (L = 1, M = 9, H = 5); csf1raV614M n = 15 (L = 4, M = 7, H = 4); csf1raΔ5bp n = 15 (L = 12, M = 2, H = 1); csf1ains2bp n = 14 (L = 7, M = 6, H = 1); csf1bΔ2bp n = 16 (L = 4, M = 9, H = 3). (D) lcp1 WISH of 36hpf WT embryos injected with PBS (control), and csf1ains2bp mutant embryos injected with PBS (control), csf1a mRNA or recombinant zebrafish Csf1a protein. WT, control n = 17 (L = 0, M = 14, H = 3); csf1ains2bp, control n = 45 (L = 32, M = 13, H = 0), + csf1a n = 32 (L = 15, M = 17, H = 0), + Csf1a n = 35 (L = 14, M = 21, H = 0). (C-D) Violin plot graphs show the level of lcp1 expression in the CHT region of individual embryos (L = low, M = medium, H = high) with median represented by a black line. (A-D) The level of statistical significance was determined by Mann-Whitney U test. *P < .04, **P < .007, ***P < .0001. All fluorescent images were acquired on Zeiss AxioZoom.V16 with Zeiss Axiocam 506 mono camera and ZEN Blue software. Bright field images of WISH were acquired on Zeiss AxioZoom.V16 with Zeiss Axiocam 105 color camera and processed using the Extended Depth of Focus module in the ZEN Blue software. FIJI and Adobe Photoshop were used for image processing. |

il34 binds to csf1rb and regulates the embryonic granulocytic fate. (A) SBB staining of a 4 dpf larva. The analyzed area is marked with a red rectangle. (B-C) SBB-positive cells were manually counted and the level of statistical significance was determined by Mann-Whitney U test. **P < .006, ***P < .0001. (B) SBB in WT, csf1rbΔ4bp and il34Δ5bp at 4 dpf. The graph on the right shows the number of SBB-positive cells during zebrafish embryonal and larval development, 2 to 7 dpf. 2 dpf: WT n = 21, csf1rbΔ4bp n = 24, il34Δ5bp n = 21; 3 dpf: WT n = 21, csf1rbΔ4bp n = 24, il34Δ5bp n = 18; 4 dpf: WT n = 21, csf1rbΔ4bp n = 26, il34Δ5bp n = 23; 7 dpf: WT n = 18, csf1rbΔ4bp n = 13, il34Δ5bp n = 21. (C) il34 and csf3a ligands were overexpressed by mRNA microinjection in 1-cell stage WT or csf1rbΔ4bp mutant embryos. Control embryos were injected with PBS. SBB staining was performed at 4 dpf. The graph on the right shows the number of SBB-positive cells. WT: control n = 46, + il34 n = 41, + csf3a n = 22; csf1rbΔ4bp: control n = 19, + il34 n = 18, + csf3a n = 12. (D) WISH of 4 dpf larvae showing the expression of mpx in WT or mutant csf1rbΔ4bp embryos with overexpressed il34 or csf3a ligands. Violin plots show the level of mpx expression in individual embryos (L = low, M = medium, H = high) with median represented by a black line. WT: control n = 44 (L = 11, M = 23, H = 10), + il34 n = 51 (L = 3, M = 16, H = 32), + csf3a n = 46 (L = 4, M = 11, H = 31); csf1rbΔ4bp: control n = 48 (L = 38, M = 9, H = 1), + il34 n = 40 (L = 34, M = 6, H = 0), + csf3a n = 44 (L = 19, M = 19, H = 6). The level of statistical significance was determined by Mann-Whitney U test. ***P < .0003. (E) Coexpression of csf1ra (red) and mpx (green) visualized in 72 hpf triple transgenic embryos Tg(fms:GAL4;UAS:mCherry);Tg(mpx:EGFP): (Ea) whole embryo, (Eb) caudal hematopoietic tissue (CHT) region. (F) HCR WISH of 72hpf embryos for csf1rb (red) and mpx (green). (Fa) whole embryo, (Fb) CHT region. All SBB staining and WISH bright field images were acquired on Zeiss AxioZoom.V16 with Zeiss Axiocam 105 color camera and processed using the Extended Depth of Focus module in the ZEN Blue software. FIJI and Adobe Photoshop were used for image processing. Fluorescence images were taken on Dragonfly 503 microscope (Andor) using Zyla-4.2 sCMOS camera with magnification ×10 and processed with the Fusion software, FIJI, and Adobe Photoshop. |

csf1rb is indispensable for definitive granulopoiesis. (A) Number of neutrophils in adult Tg(mpx:EGFP) = WT and Tg(mpx:EGFP);csf1rbΔ4bp = csf1rbΔ4bp fishtails. Neutrophils were manually counted in the area of the yellow square. WT n = 14, csf1rbΔ4bp n = 10. The level of statistical significance was determined by an unpaired 2-tailed t test. *P < .04. (B) FACS analysis of WKM cell suspension from WT, csf1rbΔ4bp, and il34Δ5bp adult zebrafish. WKMs pooled from 2 fish in 3 biological replicates, and 1 representative plot is shown for each condition. The numbers in FSC/SSC plots represent the mean percentage with SD in the gates of myeloid cells (pink gate), progenitors (blue gate), and lymphoid and small progenitor cells (green gate). The percentage of WKM cells in the myeloid gate is also shown in the bar graph on the right. (C-D) Ex vivo culture of WKM cells treated with Csf1a, Csf1b, or Il34 proteins. (C) After 3 days in culture, smears of suspension cells were stained on microscopic glass slides with May-Grünwald and Giemsa (MGG), and the number of differentiated cells (monocytes, macrophages, and granulocytes) was counted. The graph on the bottom shows the mean percentage of cells with SD. The level of statistical significance was determined by an unpaired 2-tailed t test. *P < .04. The scale bar on the microscopic image is 20 µm. Results from 3 biological replicates. (D) After 3 days in culture, adherent cells on the dish were washed with PBS, stained with MGG, and the number of small, medium, and large osteoclasts was counted in 20 fields of view with a magnification ×20 objective. The graph on the bottom shows the mean percentage of cells with SD. Results from 2 biological replicates. The scale bar on the microscopic image is 50 µm. Fluorescence images were acquired on Zeiss AxioZoom.V16 with Zeiss Axiocam 506 mono camera and ZEN Blue software. ImageJ and Adobe Photoshop were used for image processing. Bright-field images of ex vivo cultures were acquired on Leica DM 2000 microscope with Zeiss Axiocam 105 color camera. |
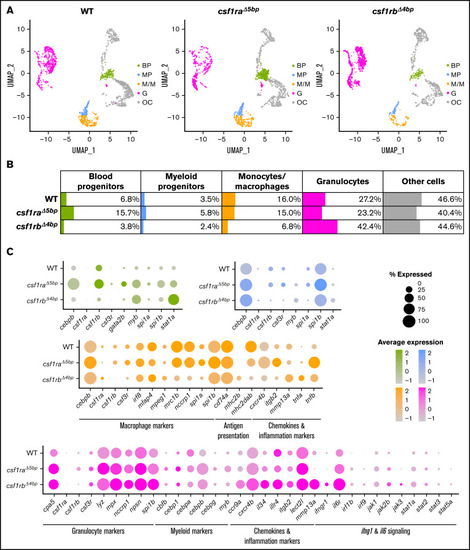
Single-cell RNA sequencing (scRNA-seq) of adult WT, csf1raΔ5bp, and csf1rbΔ4bp WKM cells shows differentially expressed hematopoietic genes. (A-C) WKMs of 1 to 2 animals were pooled for each sample. (A) Clusters in Dim plots represent individual selected populations of WKM hematopoietic cells. The identity of each cluster is based on likely cell origin according to lineage marker gene expression. Green, blood progenitors (BP); blue, myeloid progenitors (MP); orange, monocytes/macrophages (M/M); pink, granulocytes (G); gray, other cells (OC). (B) Table representing the percentage of cells in each population for WT and respective mutants. (C) Dot plot visualization of scRNA-seq gene expression in individual populations of WKM hematopoietic cells of WT and respective mutants. The color of each dot represents the level of expression (also depicted in the histogram), and the size of the dot shows the percentage of cells expressing each individual gene. |