
- Title
-
A Rapid Screening Method of Candidate Probiotics for Inflammatory Bowel Diseases and the Anti-inflammatory Effect of the Selected Strain Bacillus smithii XY1
- Authors
- Huang, X., Ai, F., Ji, C., Tu, P., Gao, Y., Wu, Y., Yan, F., Yu, T.
- Source
- Full text @ Front Microbiol
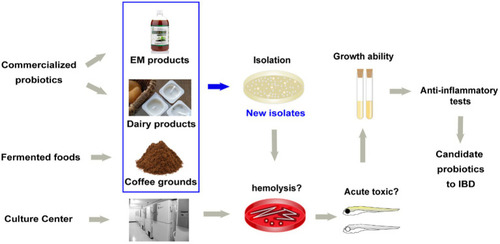
Source of strains and the screening method of candidate probiotics for inflammatory bowel diseases. |
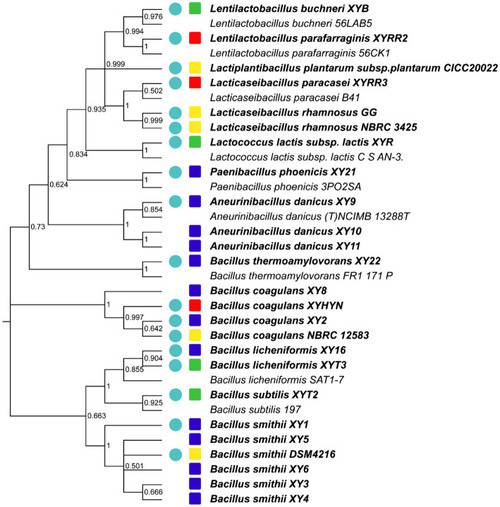
Phylogenetic relatedness of 16S rRNA between in vivo and in vitro safe strains isolated from different sources. Bold fonts mean strains used in this test. The circle indicates that the strain has the best growth ability from the same species and is isolated from the same sample. The colors of squares represent the sources of strains. Green, EM products; Red, dairy products; Yellow, culture centers; and Blue, coffee grounds. |
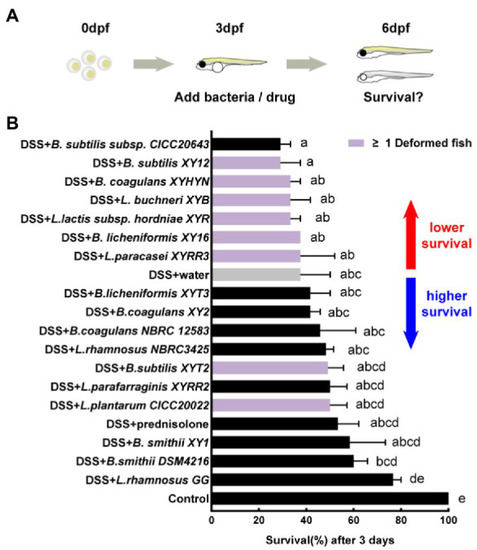
First hits on reducing mortality of acute colitis. (A) Schematic depicts the screening methodology to reduce the mortality of 0.6% dextran sodium sulfate (DSS) induced acute colitis. (B) Survival of larvae after 1-day immersion of bacteria suspension, data are presented as mean ± SEM, n ≥ 8 biologically independent animals from three independent experiments. Strain is considered an effective candidate when the mean survival rate exceeds water control (gray). Values indicated by the bars with different letters are significantly different (p < 0.05, one-way ANOVA). PHENOTYPE:
|

Second hits on reducing intestinal inflammation. (A) Schematic depicts the screening methodology to suppress neutrophilic inflammation. (B) Representative images of live imaging in 6 days post-fertilization (dpf) Tg (mpx:EGFP)i114 larvae exposed to 0.5% DSS at 3 dpf and treated with a drug and bacteria at 5 dpf. The area of the intestine is illustrated by a white dotted line, scale bars, 500 μm. (C) The number of neutrophils in the intestine per larvae, data are presented as mean ± SEM. Values indicated by the bars with different letters are significantly different (p < 0.05, one-way ANOVA). n ≥ 8 biologically independent animals from three independent experiments. PHENOTYPE:
|

Bacillus smithii XY1 protects the intestine epithelium. (A) Hematoxylin and eosin (H&E) staining of a longitudinal section of zebrafish larvae intestine, scale bars, 50 μm, and yellow arrows indicate the length of the villi. Blue arrows indicate obvious gaps because of the thinner mucosal layer. (B) The mRNA level of immune-related genes including IL-1β, NOD2, IL-6, and TNF-α in the 6 dpf larvae. Data are presented as mean ± SEM. *p < 0.05 and **p < 0.01, analyzed by two-tail test. Every character represents the significance of a treatment group compared to the control group. n = 6 from three independent experiments. |