
- Title
-
PI(3,4)P2-mediated cytokinetic abscission prevents early senescence and cataract formation
- Authors
- Gulluni, F., Prever, L., Li, H., Krafcikova, P., Corrado, I., Lo, W.T., Margaria, J.P., Chen, A., De Santis, M.C., Cnudde, S.J., Fogerty, J., Yuan, A., Massarotti, A., Sarijalo, N.T., Vadas, O., Williams, R.L., Thelen, M., Powell, D.R., Schueler, M., Wiesener, M.S., Balla, T., Baris, H.N., Tiosano, D., McDermott, B.M., Perkins, B.D., Ghigo, A., Martini, M., Haucke, V., Boura, E., Merlo, G.R., Buchner, D.A., Hirsch, E.
- Source
- Full text @ Science

Loss of PI3K-C2α induces defective abscission and early senescence.
A) Quantification and representative images of SA-b-gal–positive fibroblasts derived from Family I, II, and III after 2 weeks in culture. +/+ genotypes are shown in the chart as pulled together. (B) Immunoblot analysis of p16INK4A protein level in fibroblasts derived from Family I after 2 weeks in culture. (C) Quantification and representative images of the ratio between lens and eye size in control and pik3c2a morphant 72 hours post-fertilization (hpf) zebrafish embryos. (D) Quantification and representative images of SA-b-gal intensity on the lens of control and pik3c2a morphant 72-hpf embryos. (E) Immunoblot analysis of p16INK4A and PI3K-C2α in control and pik3c2a morphant embryos (n = 4 pools of 15 embryos each). (F and G) Confocal images of whole-mount immunofluorescence performed on 72-hpf embryos lens using MKLP1 (red) and Aur-B (green) antibodies to stain midbody and TO-PRO-3 (gray) to stain nuclei. (H) Immunofluorescence of wild-type and Pik3c2a−/− embryo sections by using a-tubulin to mark intercellular bridges connecting cells in cytokinesis. (I) Quantification of the number of cells connected by bridges (%). n = 6 fields in at least four independent experiments. (J) Time-lapse analysis of the time required to progress from anaphase to cytokinesis in fibroblasts derived from patients with homozygous deletion of PI3K-C2α or in control fibroblasts treated with PITCOIN1. (K) (Left) Immunofluorescence of p16INK4A (red), DNA (blue), and a-tubulin (green) in wild-type and PI3K-C2α-null fibroblast. (Right) Quantification of cell area in control and PIK3C2A-null fibroblasts. If not previously specified, all results are shown as mean or representative picture of at least three independent experiments ± SEM. *P < 0.05; **P < 0.01; ***P < 0.001. EXPRESSION / LABELING:
PHENOTYPE:
|
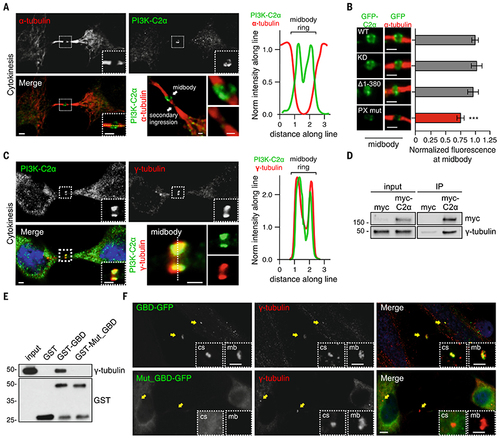
PI3K-C2α localizes to midbody through the PX- and the g-tubulin–binding domain.
A) Confocal images of HeLa cells stained for PI3K-C2α (green) and a-tubulin (red) (left) during cytokinesis and (right) fluorescence intensity along the line showing localization of PI3K-C2α at midbody. (B) Hela cells transfected with wild-type, kinase inactive (KD), clathrin-binding deletion (D1-380), and PX-binding mutant PI3K-C2α GFP-tagged. Immunofluorescence staining by using antibody to GFP showing (left) the enrichment of the different PI3K-C2α constructs and (right) their quantification at the midbody. (C) Confocal images of (left) HeLa cells stained for PI3K-C2α (green), 4′,6-diamidino-2-phenylindole (DAPI) (blue), and g-tubulin (red) and (right) fluorescence intensity along the line showing colocalization between PI3K-C2α and g-tubulin. (D) Immunoprecipitation of myc-PI3K-C2α from cells synchronized in cytokinesis. (E) Pull-down experiment by using GST-GBD and GST-GBDQ1022A-T1025A-S1081A from cells synchronized in cytokinesis. (F) Immunofluorescence staining of GFP-GBD and GFP-GBDQ1022A-T1025A-S1081A (green) with g-tubulin (red) during cytokinesis. Enlarged section shows colocalization with centrosome and midbody. If not previously specified, all results are shown as mean or representative picture of at least three independent experiments ± SEM. ***P < 0.001. |
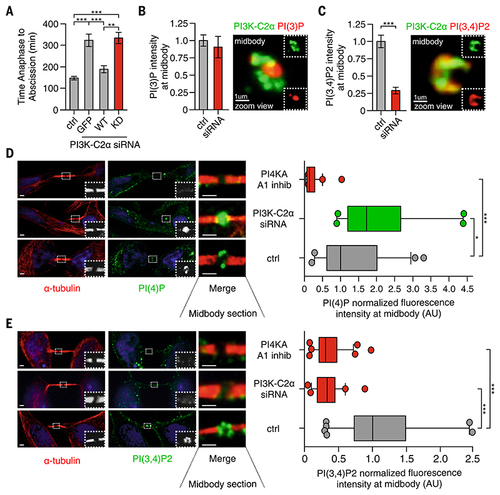
PI3K-C2α produces PI(3,4)P2 at the midbody ring.
(A) Time-lapse microscopy measuring the time required to progress from anaphase to abscission in HeLa cells treated with siRNA for PI3K-C2α alone or expressing GFP and siRNA-resistant GFP–wild-type (WT) or GFP-kinase inactive (KD) form of PI3K-C2α. n ≥ 25 cells imaged. (B) (Left) Quantification of PI(3)P levels at midbody by means of immunofluorescence staining (n ≥100 cells) and (right) confocal image of 3D reconstructed midbody stained for PI(3)P (red) and PI3K-C2α (green). (C) (Left) Quantification of PI(3,4)P2 levels at midbody by immunofluorescence staining (n ≥100 cells) and (right) confocal image of 3D reconstructed midbody stained for PI(3,4)P2 (red) and PI3K-C2α (green). (D) Quantification of PI(4)P levels at midbody in control, A1 inhibitor, and siRNA-treated cells. n ≥100 cells, mean ± SD. (E) Quantification of PI(3,4)P2 levels at midbody in control, A1 inhibitor, and siRNA-treated cells. n ≥100 cells, mean ± SD. If not previously specified, all results are shown as mean or representative picture of at least three independent experiments ± SEM. *P < 0.05; **P < 0.01; ***P < 0.001. |
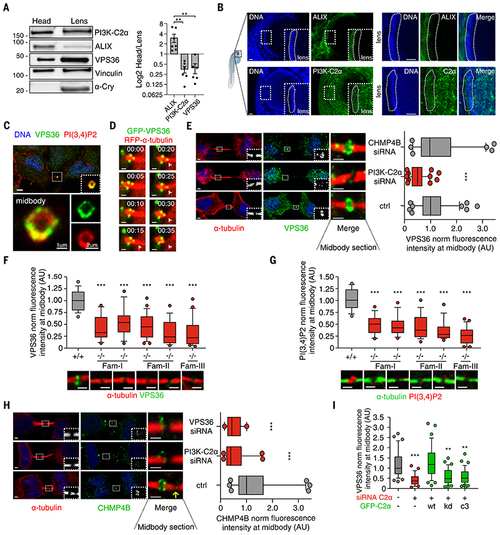
PI3K-C2α/VPS36 axis is an ALIX alternative pathway to recruit CHMP4B to the midbody in lens.
(A) Immunoblot analysis and protein quantification showing ALIX/PI3K-C2α expression ratio in zebrafish lens. (B) Immunofluorescence showing (top) ALIX or (bottom) PI3K-C2α expression in 72-hpf zebrafish lens. (C) Immunofluorescence staining showing colocalization between endogenous VPS36 and PI(3,4)P2 at the midbody ring. (D) Snapshots taken from time-lapse imaging of GFP-VPS36 during cytokinesis in HeLa cells stably expressing red fluorescent protein (RFP)–a-tubulin. Arrowheads indicate enrichment of VPS36 at the abscission site. (E) Quantification of VPS36 levels at midbody in control and siRNA-treated cells. n ≥ 200 cells, mean ± SD. (F and G) Immunofluorescence staining and quantification of endogenous (F) VPS36 and (G) PI(3,4)P2 levels at the midbody in fibroblasts derived from patients with homozygous deletion of PI3K-C2α. +/+ genotypes were pulled together. n ≥ 50 cells, mean ± SD. (H) Quantification of CHMP4B levels at midbody in control and siRNA-treated HeLa cells. n ≥ 120 cells, mean ± SD. (I) Quantification of VPS36 levels at midbody in control and siRNA treated cells upon transfection of siRNA-resistant WT, KD, and PI(3)P–producing (C3) forms of PI3K-C2α. n ≥ 30 cells, mean ± SD. If not previously specified, all results are shown as mean or representative picture of at least three independent experiments ± SEM. **P < 0.01; ***P < 0.001. EXPRESSION / LABELING:
|
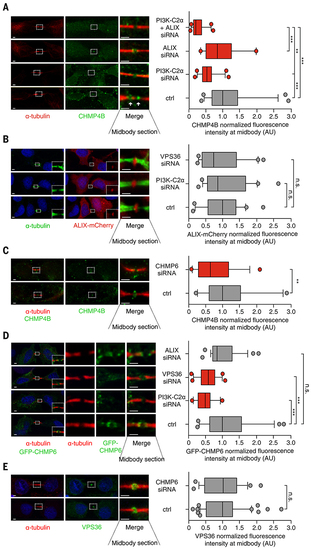
VPS36 recruits CHMP4B to the midbody through ALIX parallel pathway.
(A) Quantification of CHMP4B levels at midbody in HeLa cells treated with control siRNA or siRNA targeting PI3K-C2α, ALIX, or PI3K-C2α and ALIX. n ≥ 50 cells, mean ± SD. (B) Quantification of ALIX levels at midbody in HeLa cells transfected with ALIX-Cherry and treated with control or siRNA targeting PI3K-C2α or VPS36. n ≥ 60 cells, mean ± SD. (C) Quantification of CHMP4B levels at midbody in HeLa cells treated with control or siRNA targeting CHMP6. n ≥ 45 cells, mean ± SD. (D) Quantification of CHMP6 levels at midbody in HeLa cells transfected with GFP-CHMP6 and treated with control or siRNA targeting PI3K-C2α, VPS36, or ALIX. n ≥ 50 cells, mean ± SD. (E) Quantification of VPS36 levels at midbody in HeLa cells treated with control or siRNA targeting CHMP6. n ≥ 40 cells. If not previously specified, all results are shown as mean or representative picture of at least three independent experiments. (n.s. = not significant; **P < 0.01; ***P < 0.001). |

PI(3,4)P2 is required for VPS36 recruitment to the midbody.
(A and B) (Left) Immunofluorescence and (right) quantification by using Imaris software of the colocalization between GFP-VPS36 WT or GFP-VPS36-yMut with either (A) PI(3)P or (B) PI(3,4)P2. (C) Lipid sedimentation assay showing binding of WT and yMut VPS36 to PI(3,4)P2 and PI(3)P. (D) Pull-down experiment by using PI(3,4)P2–coated beads and lysates from cells expressing WT, yMut, or H0m VPS36. (E) Time-lapse of HeLa cells stably expressing RFP–a-tubulin, showing localization of WT, H0m, or yMut VPS36 enrichment at the midbody during abscission. Quantification reports the average fluorescence intensity observed in n ≥ 60 cells and normalized on total GFP fluorescence inside each cell (mean ± SD). If not previously specified, all results are shown as mean or representative picture of at least three independent experiments ± SEM. *P < 0.05; ***P < 0.001. |
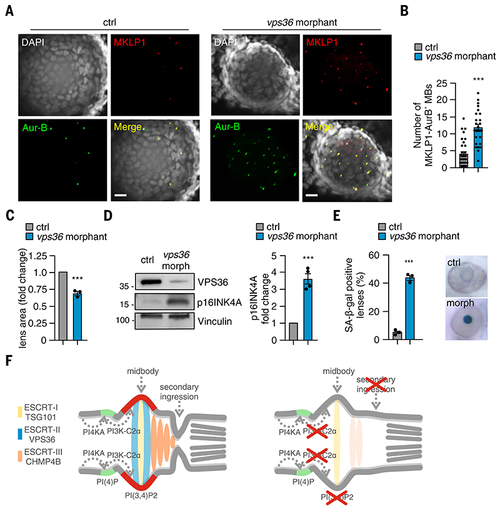
Loss of VPS36 impairs abscission and leads to senescence in vitro and in vivo.
(A) Confocal images of whole-mount immunofluorescence performed on 72-hpf embryos lens by using MKLP1 (red) and Aur-B (green) antibodies to stain midbody and TO-PRO-3 (gray) to stain nuclei. (B) Quantification of number of MKLP1 and Aur-B–positive midbody in 72-hpf embryos lens. (C) Measure of lens area in control and vps36 morphants. (D) Immunoblot analysis and quantification of p16INK4A in control and vps36 morphant 72-hpf embryos. n = 4 pools of 15 embryos each. (E) Quantification and representative images of SA-b-gal intensity on the lens of control and morphant (vps36) 72-hpf embryos. (F) During cytokinesis, PI3K-C2α produced PI(3,4)P2 (red) at the midbody by converting PI(4)P (light blue) synthetized by PI4KA. PI(3,4)P2 triggers the recruitment and the stabilization of the ESCRT-II subunits VPS36 (green), which in turn contributed to the accumulation of ESCRT-III CHMP4B at the midbody. When PI3K-C2α is lost, the secondary ingression where abscission occurs does not form properly, resulting in impaired abscission. This leads to defective cytokinesis and early onset of senescence, which is particularly evident in the lens epithelium. If not previously specified, all results are shown as mean or representative picture of at least three independent experiments ± SEM. ***P < 0.001. EXPRESSION / LABELING:
PHENOTYPE:
|

Fig. S3. Loss of PI3K-C2α leads to cataract in zebrafish and human, and increased senescence in the mouse lens. (A) Adult zebrafish were anesthetized with tricaine and examined. Coaxial illumination using a Leica M841 surgical microscope was used to visualize lenticular defects. Optical sectioning by changing the z-axis focus was used to aid in the identification of cataracts. All zebrafish examined for cataracts were offspring of a cross between pik3c2asa10124/+ and pik3c2asa12328/+ fish. (B) Representative images of posterior lenticonus cataract in one of the PIK3C2A-null patients. Arrows indicate opacities in lens. (C) Representative images of eyes and their H&E-stained sections derived from a wild-type and a Pik3c2ahypo/hypo mouse 30 days after birth. (D) Immunohistochemistry using anti-KI-67 antibody in eye sections from wild-type and Pik3c2ahypo/hypo mice at 30 days after born and quantification of percentage of KI-67 positive nuclei in wild-type and Pik3c2ahypo/hypo mice. (E) Immunohistochemistry using anti-p16INK4A antibody in eye 5 sections as in (C) from wild-type and Pik3c2ahypo/hypo mice at 30 days after birth. If not previously specified, all results are shown as mean or representative picture of at least three independent experiments ± SEM (*P<0.05; **P<0.01; ***P<0.001). PHENOTYPE:
|