
- Title
-
A chemical screen based on an interruption of zebrafish gastrulation identifies the HTR2C inhibitor Pizotifen as a suppressor of EMT-mediated metastasis
- Authors
- Nakayama, J., Tan, L., Li, Y., Goh, B.C., Wang, S., Makinoshima, H., Gong, Z.
- Source
- Full text @ Elife

(A) Cumulative results of the chemical screen in which each drug was used at either 10 µM (left) or 50 µM (right) concentrations. 1280 FDA, EMA, or other agencies-approved drugs were subjected to this screening. Positive ‘hit’ drugs were those that interrupted epiboly progression. (B) Representative samples of the embryos that were treated with indicated drugs.
|
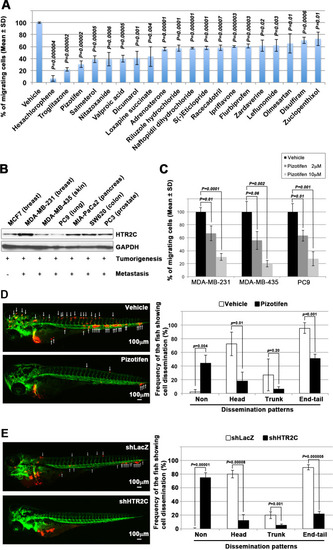
(A) Effect of the epiboly-interrupting drugs on cell motility and invasion of MBA-MB-231 cells. MBA-MB-231 cells were treated with vehicle or each of the epiboly-interrupting drugs and then subjected to Boyden chamber assays. Fetal bovine serum (1% v/v) was used as the chemoattractant in both assays. Each experiment was performed at least twice. (B) Western blot analysis of HTR2C levels (top) in a non-metastatic human cancer cell line, MCF7 (breast) and highly metastatic human cancer cell lines, MDA-MB-231 (breast), MDA-MB-435 (melanoma), PC9 (lung), MIA-PaCa2 (pancreas), PC3 (prostate), and SW620 (colon); GAPDH loading control is shown (bottom). (C) Effect of pizotifen on cell motility and invasion of MBA-MB-231, MDA-MB-435, and PC9 cells. Either vehicle or pizotifen treated the cells were subjected to Boyden chamber assays. Fetal bovine serum (1% v/v) was used as the chemoattractant in both assays. Each experiment was performed at least twice. (D) and (E) Representative images of dissemination of 231R, shLacZ 231R or shHTR2C 231R cells in zebrafish xenotransplantation model. The fish larvae that were inoculated with 231R cells were treated with either vehicle (top left) or the drug (lower left) (D). The fish larvae that were inoculated with either shLacZ 231R or shHTR2C 231R cells (lower left) (E). White arrows head indicate disseminated 231R cells. The images were shown in 4× magnification. Scale bar, 100 µm. The mean frequencies of the fish showing head, trunk, or end-tail dissemination were counted (graph on right). Each value is indicated as the mean ± SEM of two independent experiments. Statistical analysis was determined by Student’s t test.
|

(A) Mean volumes (n = 10 per group) of 4T1 primary tumors formed in the mammary fat pad of either vehicle- or pizotifen-treated mice at day 10 post injection. (B) Ki67 expression level in 4T1 primary tumors formed in the mammary fat pad of either vehicle- or pizotifen-treated mice at day 10 post injection. The mean expression levels of Ki67 (n = 10 mice per group) were determined and were calculated as the mean ration of Ki67-positive cells to 4’,6-diamidino-2-phenylindole (DAPI) area. (C) Representative images of primary tumors on day 10 post injection (top panels) and metastatic burden on day 70 post injection (bottom panels) taken using an IVIS Imaging System. (D) Representative images of the lungs from either vehicle- (top) or pizotifen-treated mice (bottom) at 70 days post tumor inoculation. Number of metastatic nodules in the lung of either vehicle- or pizotifen-treated mice (right). (E) Representative hematoxylin and eosin (H&E) staining of the lung (top) and liver (bottom) from either vehicle- or pizotifen-treated mice. Black arrow heads indicate metastatic 4T1 cells. (F) The mean number of metastatic lesions in step sections of the lungs from the mice that were inoculated with 4T1-12B cells expressing short hairpin RNA (shRNA) targeting for either LacZ or HTR2C. (G) Representative H&E staining of the lung and liver from the mice that were inoculated with 4T1-12B cells expressing shRNA targeting for either LacZ or HTR2C. Black arrow heads indicate metastatic 4T1 cells. Each value is indicated as the mean ± SEM. Statistical analysis was determined by Student’s t test.
|

(A) The morphologies of the MCF7 and HaCaT cells expressing either the control vector or HTR2C were revealed by phase contrast microscopy. (B) Immunofluorescence staining of E-cadherin, EpCAM, vimentin, and N-cadherin expressions in the MCF7 cells from A. (C) Expression of E-cadherin, EpCAM, vimentin, N-cadherin, and HTR2C was examined by western blotting in the MCF7 and HaCaT cells; GAPDH loading control is shown (bottom). (D) Effect of HTR2C on cell motility and invasion of MCF7 cells. MCF7 cells were subjected to Boyden chamber assays. Fetal bovine serum (1% v/v) was used as the chemoattractant in both assays. Each experiment was performed at least twice. (E) Representative images of dissemination patterns of MCF7 cells expressing either the control vector (top left) or HTR2C (lower left) in a zebrafish xenotransplantation model. White arrow heads indicate disseminated MCF7 cells. The mean frequencies of the fish showing head, trunk, or end-tail dissemination tabulated (right). Each value is indicated as the mean ± SEM of two independent experiments. Statistical analysis was determined by Student’s t test.
|

(A) Immunofluorescence (IF) staining of E-cadherin in either vehicle- or pizotifen-treated MDA-MB-231 cells. (B) Surface expression of E-cadherin in either vehicle (black)- or pizotifen (red)-treated MDA-MB-231 cells by FACS analysis. Non-stained controls are shown in gray. (C) Protein expressions levels of E-cadherin, ZEB1, and β-catenin in the cytoplasm and nucleus of 4T1 primary tumors from either vehicle- or pizotifen-treated mice are shown; Luciferase, histone H3, and β-tubulin are used as loading control for whole cell, nuclear, or cytoplasmic lysate, respectively. (D) Protein expression levels of epithelial and mesenchymal markers and ZEB1 in either vehicle- or pizotifen-treated MDA-MB-231 cells or E-cadherin-positive (E-cad+) cells in pizotifen-treated MDA-MB-231 cells are shown. (E) IF staining of β-catenin in the MCF7 cells expressing either vector control (top left, bottom left) or HTR2C (top right, bottom right). (F) Expressions of β-catenin in the cytoplasm and nucleus of MCF7 cells. (G) IF staining of β-catenin in either vehicle (top left, bottom left) or pizotifen-treated MDA-MB-231 cells (top right, bottom right). (H) Expressions of β-catenin in the cytoplasm and nucleus of MDA-MB-231 cells and the E-cad+ cells.
|