
- Title
-
Together is Better: mRNA Co-Encapsulation in Lipoplexes is Required to Obtain Ratiometric Co-Delivery and Protein Expression on the Single Cell Level
- Authors
- Zhang, H., Bussmann, J., Huhnke, F.H., Devoldere, J., Minnaert, A.K., Jiskoot, W., Serwane, F., Spatz, J., Röding, M., De Smedt, S.C., Braeckmans, K., Remaut, K.
- Source
- Full text @ Adv Sci (Weinh)
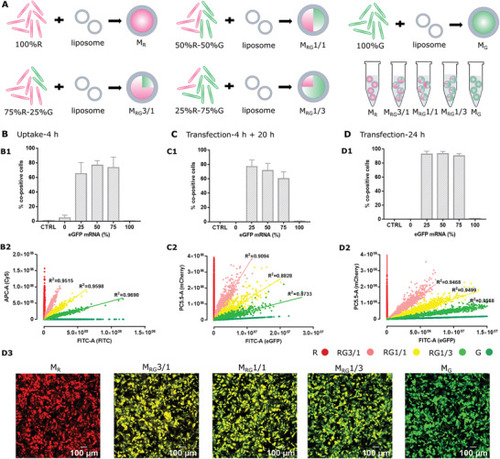
A) The mixture of Cy5 mRNA (red, R*) and FITC mRNA (green, G*) at an R*/G* ratio of 100/0, 75/25%, 50/50%, 25/75%, and 0/100% w/w was formulated into mingle-lipoplexes, before being applied to cells. B) Mingle-lipoplexes that contain Cy5 luciferase mRNA and FITC luciferase mRNA at an R*/G* ratio of 100/0%, 75/25%, 50/50%, 25/75%, and 0/100% w/w were incubated with HeLa cells for 4 h to examine the cellular uptake. C,D) Mingle-lipoplexes that contain mCherry mRNA and eGFP mRNA at an R/G ratio of 100/0%, 75/25%, 50/50%, 25/75%, and 0/100% w/w were incubated with HeLa cells. C) After 4 h incubation, cells were rinsed and left to grow for another 20 h in fresh culture medium before flow cytometry measurements. D) After 24 h incubation (no washing step) cells were examined (D1, D2) by flow cytometry and (D3) by confocal microscopy. (B1, C1, D1) Percentage of co-positive cells, (B2, C2, D2) correlation between red and green fluorescence as derived from flow cytometry dot plots. Scale bar: 100 µm. All the data was averaged from three independent experiments, with three replicates per repeat (n = 9). The total mRNA amount was kept constant at 0.2 µg/well. |
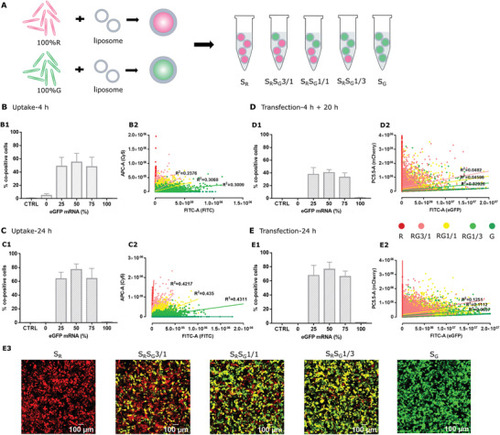
A) Cy5 mRNA or FITC mRNA is encapsulated separately into single-lipoplexes, and the desired R*/G* ratios are obtained by mixing single-R*- and single-G*-lipoplexes at an R*/G* ratio of 100/0%, 75/25%, 50/50%, 25/75%, and 0/100% w/w. B,C) Single-lipoplexes mixtures that contain Cy5 luciferase mRNA single-lipoplexes and FITC luciferase mRNA single-lipoplexes at an R*/G* ratio of 100/0%, 75/25%, 50/50%, 25/75%, and 0/100% w/w were incubated with HeLa cells to examine the cellular uptake. B) After 4 h incubation, cells were rinsed and left to grow for another 20 h in fresh culture medium before flow cytometry measurements. C) After 24 h incubation (no washing step) cells were examined by flow cytometry. D,E) Single-lipoplexes mixtures that contain mCherry mRNA single-lipoplexes and eGFP mRNA single-lipoplexes at an R/G ratio of 100/0%, 75/25%, 50/50%, 25/75%, and 0/100% were incubated with HeLa cells for (D) 4 h (followed by a washing step) or (E) 24 h (no washing step) and protein expression was determined at 24 h (E1, E2) by flow cytometry measurements and (E3) by confocal microscopy. (B1, C1, D1, E1) Percentage of co-positive cells, (B2, C2, D2, E2) correlation between red and green fluorescence as derived from flow cytometry dot plots. Scale bar: 100 µm. All the data was averaged from three independent experiments, with three replicates per repeat (n = 9). The total mRNA amount was kept constant at 0.2 µg/well. |

Subsequent transfection of eGFP mRNA single-lipoplexes and mCherry mRNA single-lipoplexes. A1,B1) Transfection scheme of cells, A2,B2) representative confocal images of cells after 1 time (left panel) and 2 times (right panel) transfection with single-lipoplexes. A3,B3) Representative flow cytometry dot plots of cells receiving two subsequent transfections and A4,B4) correlation between red and green fluorescence as derived from flow cytometry dot plots. Scale bar: 100 µm. All the experiments have been triplicated in three independent days (n = 9). The mRNA dose was 0.1 µg/well per transfection round, leading to a total mRNA amount of 0.2 µg/well after the second transfection. |

Simultaneous best fit (blue solid line) of the 4 correlation functions to the experimental correlation values (red circles) with D(K), pe and m as global fitting parameters. From left to right the four considered conditions are displayed in order of decreasing correlation: cargo uptake delivered by mingle-lipoplexes, cytosolically released cargo from mingle-lipoplexes, cargo uptake by single-lipoplexes and cytosolically released cargo from single-lipoplexes. Per condition the three considered cargo amounts are included: α1 = 0.25, 0.5, and 0.75 (corresponding to α1 = 0.75, 0.5, and 0.25, respectively) |

Representative images of A) retinal organoids and B,C) zebrafish embryos transfected with mRNA lipoplexes. (A) Briefly, retinal organoids at day 22 of cultivation were incubated with (A2) 100% mCherry mRNA lipoplexes, (A3) 100% eGFP mRNA lipoplexes, (A4-A6) mingle-lipoplexes containing mCherry/eGFP mRNA at a ratio of 75/25%, 50/50%, 25/75% w/w or (A7-A9) mixtures of mCherry mRNA single-lipoplexes and eGFP mRNA single-lipoplexes at a ratio of 75/25%, 50/50%, and 25/75% w/w. The non-treated retinal organoids were used as control (A1). All the experiments were performed in triplicate (n = 9). At 24 h post-administration, retinal organoids were fixed by 2% PFA for images by microscopy. Scale bar: 100 µm. B) Zebrafish embryos of 48 h post fertilization were microinjected at the hindbrain ventricle with (B1) 100% mCherry mRNA lipoplexes, (B2) 100% eGFP mRNA lipoplexes, (B3-B5) mingle-lipoplexes containing mCherry/eGFP mRNA at a ratio of 75/25%, 50/50%, 25/75% w/w or (B6-B8,) mixtures of mCherry mRNA single-lipoplexes and eGFP mRNA single-lipoplexes at a ratio of 75/25%, 50/50%, and 25/75% w/w. At 24 h after injection, embryos were embedded in agarose and imaged using confocal microscope at 40x magnification (72 h post fertilization in total). C) Representative images of zebrafish embryos 24 h after injection (72 h post fertilization) at 10x magnification. (C1) schematic of a zebrafish embryo, (C2) mingle-lipoplexes containing mCherry/eGFP mRNA at a ratio of 50/50% (w/w and (C3) mixtures of mCherry mRNA single-lipoplexes and eGFP mRNA single-lipoplexes at a ratio of 50/50% w/w). Around 15–20 zebrafish embryos were injected for each sample. Scale bar: 100 µm. The total mRNA amount was kept constant at 1 µg/well for retinal organoids, and 0.2 ng/injection for zebrafish embryos. |

Schematic illustration of A) mRNA mingle-lipoplexes and B) mRNA single-lipoplexes at an R/G ratio of 1/1 that are being applied onto cells. (a, a’) mRNA lipoplexes are internalized into cells through endocytosis or (a’’) cell membrane fusion, (b, b’) the internalized lipoplexes escape from endosomal compartments, releasing free mRNA into the cytosol of cells, (c, c’) cytosolic mRNA can be translated leading to the target protein expression. C) Correlation derived from the flow cytometry dot plots of HeLa cells that were respectively applied with MRG1/1 and SRSG1/1. For cellular uptake, mRNA lipoplexes were incubated with cells for 4 and 24 h, while for transfection, mRNA-lipoplexes were incubated with cells for 4 h + 20 h and 24 h, respectively. |