
- Title
-
KRas-transformed epithelia cells invade and partially dedifferentiate by basal cell extrusion
- Authors
- Fadul, J., Zulueta-Coarasa, T., Slattum, G.M., Redd, N.M., Jin, M.F., Redd, M.J., Daetwyler, S., Hedeen, D., Huisken, J., Rosenblatt, J.
- Source
- Full text @ Nat. Commun.

KRasV12 induces formation of epidermal cell masses and basal extrusion at distinct sites.
a 26 hpf wild-type zebrafish embryos expressing krt4:EGFP-CAAX or dt-KRasV12, masses indicated by black arrowheads and inset. b Mean of cell masses per embryo ± SEM, P < 0.0001 by a Mann–Whitney test, n = embryos. c Map of where cell masses occur, as observed at 28 hpf. d Stills from time-lapse imaging (hh:mm) of periderm:Lifeact-EGFP mosaically expressing EGFP-CAAX or EGFP-dt-KRasV12, showing hallmarks of apical and basal extrusion, with XZ sections beneath showing constriction at the base or apex, respectively (white arrows delimit ring constricting). e Number of apical and basal extrusions in EGFP-CAAX or dt-KRasV12 embryos. Data are mean ± SEM, **P < 0.02 by a Mann–Whitney test for apical and basal extrusions pooled together. f Maps indicating where apical and basal extrusions occur in 28-46 hpf embryos and 55–73 hpf embryos, where different colours represent different fish analyzed, n. Source data are provided as a Source Data file. |

p53 loss increases survival of internalized KRasV12 cells in the zebrafish body.
a Maximum intensity and XZ projections of EGFP-CAAX- or dt-KRasV12-injected p53mut 48 hpf embryos. The white arrowhead indicates a KRasV12 cell internalized beneath p63+ basal keratinocytes. b Quantification of invaded vs surface (live + dead) EGFP-CAAX or dt-KRasV12 cells in wild-type or p53mut embryos, expressed as a percentage of total EGFP+ cells for each embryo, n = embryos, ***P < 0.001 by a Chi-Square test. Data are represented as boxplots where the middle line is the median, the lower and upper hinges correspond to the first and third quartiles, and the whiskers extend from the minimum to the maximum. All data points are shown. c Percentage of internalized or surface cells in CAAX or dt-KRasV12 48 hpf embryos compared to total EGFP+ cells in each embryo (X-axis, log scale), where each line represents an individual p53mut embryo from (b). d Wild-type or p53mut larvae at 5 dpf expressing EGFP-CAAX or dt-KRasV12. Note that the cmlc2:GFP heart cells represent a Tol2 transgenesis marker, unrelated to CAAX or KRasV12 expression. e Percentages of 5 dpf larvae containing surface or invaded EGFP+ cells, ****P < 0.001 by a Fisher exact test. Source data are provided as a Source Data file. |
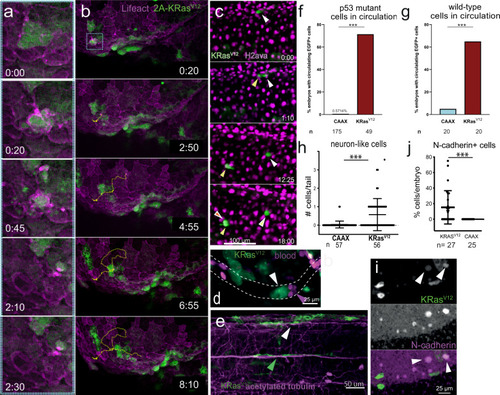
KRasV12 cells invade by BCE, migrate, divide, and adopt new plasticity.
b Stills from Supplementary Movie 8 of a basally extruding EGFP-T2A-KRasV12 cell from a periderm:Lifeact-mCherry reporter line, where (a) is a zoom inset (blue) for only the first 2.5 hrs, showing BCE and migration, tracked with dashed yellow line. c Stills from Supplementary Movie 11 of an invaded EGFP-KRasV12 cell dividing in a h2afva:h2afva-mCherry reporter line, where white, yellow, and red arrowheads indicate daughter cells from the two cell divisions. d Stills from Supplementary Movie 14 showing an EGFP-KRasV12 cell blocking flow of gata1:mCherry-labelled blood cells. In all cases, movies were from 24-48 hpf with (hh:mm). Percentage of CAAX or T2A-KRasV12 embryos with circulating EGFP+ cells in p53mut (f) and wild-type (g) zebrafish as mean + SEM, ***P < 0.001 by a Fisher Exact test, n = embryos. e T2A-KRasV12 cells with neuron-like morphology, with white arrowhead indicating co-staining with acetylated tubulin and green arrowhead aligning along a neuron. h Neuron-like EGFP-CAAX or T2A-KRasV12 cells per n embryos (beneath), ***P < 0.001 by a Mann–Whitney test. i N-cadherin immunostaining indicating some dt-KRasV12 (arrowheads) adopt this mesenchymal marker. j Percentage of invaded cells that are N-cadherin+ per embryo, as mean ± SEM, where ***P < 0.001 by a Mann–Whitney test. All graphs were from embryos fixed at 48 hpf. Source data are provided as a Source Data file. |

KRasV12 cells invade by BCE and shed apical epithelial determinants.
XZ sections of 48 hpf EGFP-dt-KRasV12 embryos with E-cadherin– internalized cells (a, arrowheads) and EGFP-CAAX embryos, where cells remaining at epidermis and are E-cadherin+ but the few that internalize are E-cadherin– (b, c, arrowhead). Those in an internal cell mass (T2A-KRasV12, arrowhead) at 5 dpf also lacks E-cadherin (d). e XZ sections of DMSO or 100 μM Dynasore-treated T2A-KRas V12/p53 MO-injected embryos showing internalized cells lack E-cadherin (arrowheads). f Percentage of invaded, surface, or mass-associated snai1b+ cells in 14 embryos, *P < 0.05, **P < 0.01 by a Friedman test and Wilcoxon signed-rank test with the Holm-Sidak adjustment for pairwise comparisons, n = 11 embryos. Data are represented as boxplots where the middle (grey) line is the mean, the hinges indicate ±SEM, and the whiskers indicate ±SD. All data points are shown. g Stills from Supplementary Movie 16 showing BCE of a EGFP-dt-KRasV12 cell in a periderm:Lifeact-mCherry line (arrowheads pointing to ring contracting), clipping off the apex (green). h XZ-section of a basally extruding EGFP-T2A-KRasV12 cell (dashed) with E-cadherin constricted apically (arrowhead). Analysis of invasion in vehicle versus chloroquine-treated (i) or Rockout-treated (j) embryos at 48 hpf, ***P < 0.001, *P < 0.05 by a Fisher Exact Test. Source data are provided as a Source Data file. |