
- Title
-
An injury-induced serotonergic neuron subpopulation contributes to axon regrowth and function restoration after spinal cord injury in zebrafish
- Authors
- Huang, C.X., Zhao, Y., Mao, J., Wang, Z., Xu, L., Cheng, J., Guan, N.N., Song, J.
- Source
- Full text @ Nat. Commun.
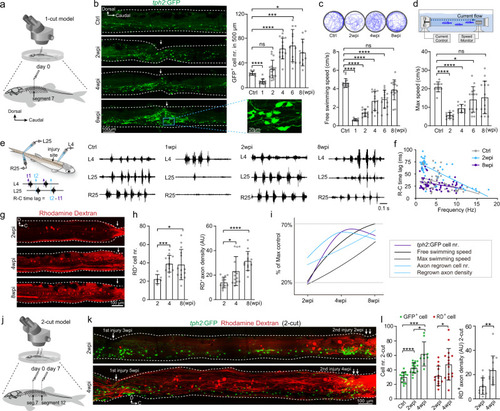
Injury-induced regeneration of intraspinal serotonergic neurons (ISNs) is positively correlated with locomotion recovery.
a Illustration of adult zebrafish one-cut spinal cord injury (SCI) model with a complete transection at the seventh segment. b (left) Immunohistochemistry images show GFP+ ISNs distribution in the lateral view of whole-mount spinal cord in uninjured (Ctrl) and SCI fish. Injury sites are indicated by white arrows. The GFP+ ISNs within the injury site in the blue box is enlarged. (right) Quantification of GFP+ ISNs numbers in the 500 μm long spinal cord covering the injury site. c Five minutes free-swimming traces recorded by camera in the 9 mm open dish, and quantification of free-swimming speed of uninjured and SCI animals. d Illustration of a forced-swimming setup, and quantification of maximum water velocity at which uninjured and SCI fish reached exhaustion. e Illustration of the multi-channel electromyogram (EMG). Typical EMG traces recorded from uninjured and SCI animals for the same duration were shown. f Plots of R–C time lag versus swimming frequency for each swimming cycle in uninjured and SCI animals. N = 4 fish in each group. g Images show rhodamine dextran (RD) retrograde labeling of spinal interneurons with axon regrowing over injury site after SCI. h Quantification of retrogradely labeled spinal interneuron numbers in the 2–4 segments rostral to the injury site and regrown axon density for semispinal thickness laterally. i Correlation analysis shows the relationship of GFP+ ISNs numbers in the injury site, the free and maximum swimming speeds, axon-regrown spinal interneuron numbers, and regrown axon density after SCI. y-Axis represent the percentage of maximum value. j Illustration of adult zebrafish 2-cut SCI model with a second complete transection at the 12th segment. k Immunohistochemistry images show GFP+ ISNs distribution and RD retrograde labeling in two-cut SCI model. l Quantification of GFP+ ISNs numbers at the second injury site, RD+ retrogradely labeled axon-regrown spinal interneuron numbers and regrown axon density rostral to the secondary injury site. All data are presented as mean ± SD. *P < 0.05, **P < 0.01, ***P < 0.001, ****P < 0.0001, significant difference. For detailed statistics, see Supplementary Table 1. |
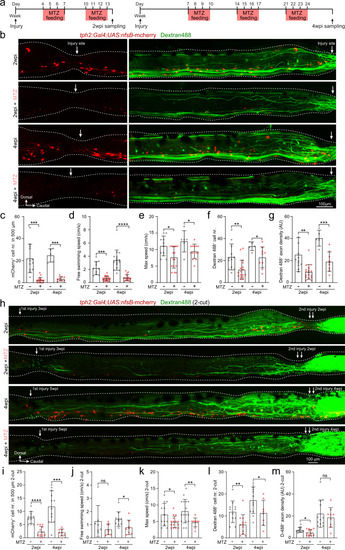
Injury-induced ISNs are indispensable for axon regrowth and locomotion recovery.
a Metronidazole (MTZ) treatment protocols used to genetically ablate mCherry+ ISNs after SCI using Tg(tph2:Gal4;UAS:nfsB-mCherry) line. b Immunohistochemistry images show the distribution of mCherry+ ISNs and Dextran 488+ retrogradely labeled axon-regrown spinal interneurons in 1-cut SCI fish with/without MTZ treatment. Injury sites are indicated by white arrows. c–g Ablation of ISNs by MTZ treatment prevents axon regrowth and locomotion recovery after SCI. Quantification of mCherry+ ISNs numbers in the region of 500 μm around the injury site (c); free-swimming speed (d); maximum swimming speed (e); retrogradely labeled axon-regrown spinal interneuron numbers (f) and regrown axon density (g) after SCI with/without MTZ treatment. h Immunohistochemistry images show the distribution of mCherry+ ISNs and Dextran 488+ retrogradely labeled axon-regrown spinal interneurons in two-cut SCI fish with/without MTZ treatment after the second injury. i–m Effect of ISNs ablation in 2-cut SCI model. Mean data of mCherry+ ISNs numbers in a 500 μm region covering the secondary injury site (i); free-swimming speed (j); maximum speed (k); retrogradely labeled axon-regrown spinal interneuron numbers (l) and regrown axon density (m) after the second injury with/without MTZ treatment. All data are presented as mean ± SD. *P < 0.05, **P < 0.01, ***P < 0.001, ****P < 0.0001, significant difference. For detailed statistics, see Supplementary Table 1. |
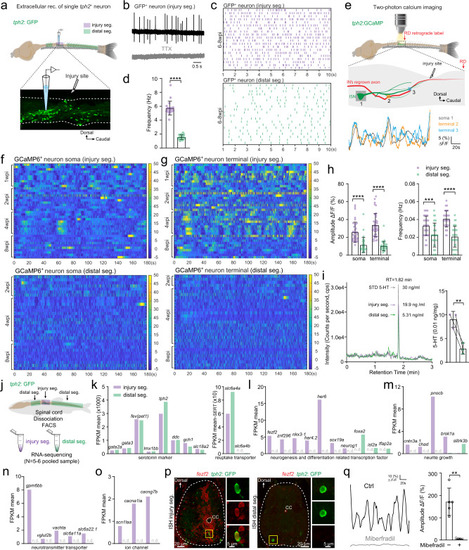
Injury-induced ISNs form a functionally distinct subpopulation actively releasing serotonin that acts on regrowing axons.
a Illustration of the in vitro spinal cord preparation for extracellular recording of the single GFP+ ISN in the injury segment (purple) and distal segments (green). b Representative extracellular recording trace of a single injury-induced GFP+ ISN spontaneous firing in the absence (upper) or presence (lower) of 1 µM TTX. c, d Raster plots (c) and quantification (d) of the spontaneous firing frequency of GFP+ ISNs in the injury segment and distal segments within 10 s. e Two-photon calcium imaging is used to examine the Ca2+ homeostasis (top) in in vitro spinal cord preparation. Typical examples of Ca2+ changes (bottom) are recorded in the GCaMP6+ ISN soma (gray) and two terminal varicosities (orange and blue) around the interneuron’s regrown axon at the injury site (middle). f, g Heatmaps showing Ca2+ oscillations during 3 min of GCaMP6+ ISNs soma in the injury segment (f upper) and distal segments (f lower), and GCaMP6+ ISNs terminal in the injury segment (g upper) and distal segments (g lower). h Quantification of Ca2+ oscillations amplitude and frequency of GCaMP6+ ISNs soma and terminal in the injury segment and distal segments. i (left) Representative LC–MS chromatograms showing retention time of standard serotonin (gray), extracellular fluid samples from injury segments (purple) and distal segments (green). (right) Quantification of serotonin released extracellularly per unit spinal cord tissue. j Sampling of GFP+ ISNs from the injury segment and distal segments of the same SCI animal for FAC-sorting and bulk RNA-seq. k–o Mean FPKM values of common serotonin markers and reuptake transporter genes (k); differentially expressed (P value < 0.05) neurogenesis and neuron differentiation related transcription factors (l); neurite growth related genes (m); neurotransmitter transporter related genes (n); ion channel genes including calcium channel gene cacna1ia (voltage-dependent t-type calcium channel) (o) in GFP+ ISNs from the injury segment and distal segments. n.d. denotes not detected. p In situ hybridization (ISH) for fezf2 combining staining for GFP on cross sections of the injury and distal spinal segment, representing results from three independent experiments. Expanded images indicated by yellow boxes showing co-labeled cells. q Representative traces and mean amplitude of the robust Ca2+ activity in GCaMP6+ ISNs terminal in the injury segment in the absence (black) and presence (gray) of Calcium channel blocker miberfradil (3 µM). All data are presented as mean ± SD. *P < 0.05, **P < 0.01, ***P < 0.001, ****P < 0.0001, significant difference. For detailed statistics, see Supplementary Table 1. |
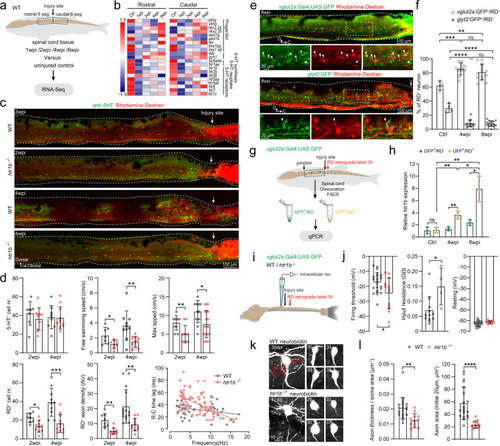
Serotonin facilitates axon regrowth of spinal interneurons via 5-HT1B receptor.
a Collection of five spinal segments rostral or caudal to the injury site from wild-type (WT) SCI fish and corresponding segments from uninjured fish (n = 3 fish for each group) for RNA-seq (N = 4–5 libraries in each group). b Heatmap of mean FPKM values showing differentially expressed serotonin related genes after SCI. Differential expression analysis was performed between two groups (Ctrl versus 1-/2-/4-/6 wpi) using the DESeq2 (adjusted P-value < 0.05 after Benjamini and Hochberg’s approach). c Immunohistochemistry images show the distribution of 5-HT+ ISNs and RD+ retrogradely labeled axon-regrown spinal interneurons in WT and htr1b−/− SCI fish. d Quantification of WT (gray dots) and htr1b−/− (red dots) SCI fish ISNs numbers in the region of 500 μm covering the injury site; free swimming speed; maximum speed; axon-regrown spinal interneuron numbers; regrown axon density and EMG recording of R–C time lag versus swimming frequency. e Immunohistochemistry images show the RD+ retrogradely labeled axon-regrown spinal interneurons in Tg(vglut2a:Gal4;UAS:GFP) (upper) and Tg(glyt2:GFP) (lower) SCI fish. Expanded images of yellow dash-line boxes show RD co-labeling with vlgut2a:GFP or glyt2:GFP (arrowheads) indicating axon-regrown excitatory or inhibitory interneurons. f Number of axon-regrown excitatory and inhibitory interneurons expressed as a percentage of RD+ neuron numbers after SCI, and comparison with the proportions of uninjured fish. g, h FAC-sorting of axon-regrown excitatory interneurons (vglut2a:GFP+/RD+) and non-labeled excitatory interneurons (vglut2a:GFP+/RD−) from uninjured and SCI fish (g) for detection of relative htr1b expression (h). i Illustration of the in vitro spinal cord preparation for whole-cell patch-clamp recording. j Mean data of electrophysiological properties of axon-regrown excitatory interneurons in SCI fish with WT and htr1b−/− background. k Morphology of recorded axon-regrown excitatory interneurons filled with neurobiotin. Soma size (red dashed lines), the initial 20 μm length and thickness of axon (red line) are highlighted in top left image and used for morphology analysis. l Quantification of axon size of recorded axon-regrown excitatory interneurons. All data are presented as mean ± SD. *P < 0.05, **P < 0.01, ***P < 0.001, ****P < 0.0001, significant difference. For detailed statistics, see Supplementary Table 1. |