
- Title
-
ASB2 is a novel E3 ligase of SMAD9 required for cardiogenesis
- Authors
- Min, K.D., Asakura, M., Shirai, M., Yamazaki, S., Ito, S., Fu, H.Y., Asanuma, H., Asano, Y., Minamino, T., Takashima, S., Kitakaze, M.
- Source
- Full text @ Sci. Rep.
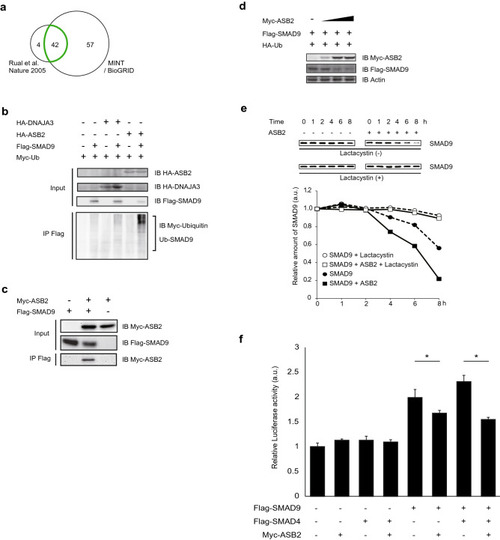
ASB2 is a novel E3 ligase of SMAD9. (a) Independent databeses of interactome were used to narrow the candidates for SMAD9-binding proteins. Finally, 42 proteins were remained (see TableTable1).1). (b–d) HEK293T cells were transfected with vectors encoding indicated tagged proteins and Flag-immunoprecipitates or lysates were separated using SDS-PAGE and immunoblotted with the indicated antibodies. (b) ASB2 but not DNAJA3 ubiquitilated SMAD. (c) ASB2 interacts SMAD9. (d) The amounts of transfected vector encoding Myc-Asb2 were 0, 0.1, 1, and 2 µg, respectively (from the left column) The total amount of the transfected vector was adjusted using empty vector. The protein amount of SMAD9 was negatively correlated with that of ASB2. (e) Pulse chase analysis. To terminate further protein synthesis, cells were treated with 50 µg/mL cycloheximide with or without 10 µM lactacystin at 24 h after transfection. Total cell lysates were obtained at the indicated times and subjected to western blot analysis. Protein levels were determined using densitometry. (f) Asb2 suppress BMP signalling through degradation of Smad9. HeLa cells were co-transfected with Xvent2-Luc plasmid, which expresses luciferase under BMP signalling, and a pGL4.75 vector as a control, which constantly expresses Renilla luciferase, and vectors encoding Flag-SMAD9, Flag-SMAD4 and Myc-ASB2 as indicated. Cells were treated with 100 µM BMP2. Using cell lysates obtained 24 h after transfection, the luminescence of both firefly and Renilla luciferase were measured. Luciferase activity under BMP signalling was normalized with Renilla luciferase activity. The cropped gel images were delineated and uncropped gel images are shown in the Supplementary Information. The data are shown as the mean ± s.d. Statistical analysis was performed using one-way ANOVA with Tukey’s multiple comparison tests. *p < 0.05; ns, not significant. |
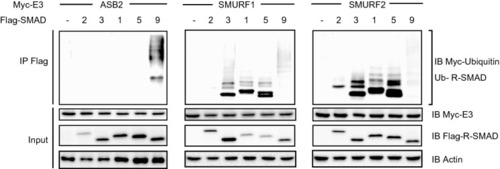
ASB2 specifically ubiquitylates SMAD9. HEK 293T cells were co-transfected with vectors coding HA-Ub, Myc-tagged E3 (Myc-ASB2, SMURF1 and SMURF2) and Flag-tagged R-SMADs (Flag-SMAD2, 3, 1, 5, 9) as indicated. Flag-immunoprecipitates or lysates were separated with SDS-PAGE and immunoblotted with the indicated antibodies. The cropped gel images were delineated and uncropped gel images are shown in the Supplementary Information. |
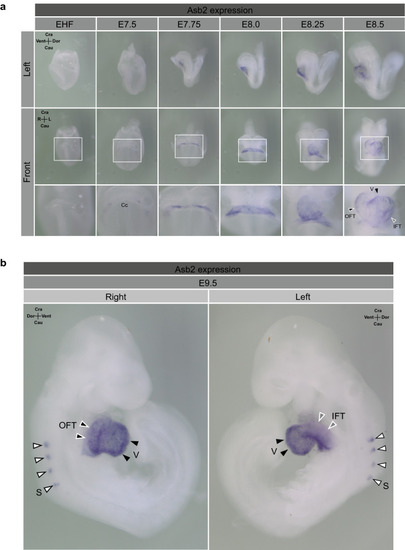
Asb2 is specifically expressed in the cardiac region during early embryogenesis of mice. Whole mount in situ hybridization was performed using murine embryos. (a) Asb2 expression was detected in the cardiac region as early as formation of the cardiac crescent at E7.5. Thereafter, Asb2 expression was localized at the cardiac region until cardiac formation was completed. (b) At E9.5, Asb2 expression was detected in the ventricular myocardium and outflow and inflow tracts. Additionally, extra-cardiac expression of Asb2 was initiated at several somites at this stage. EHF, early head fold; Cc, cardiac crescent; OFT, outflow tract; IFT, inflow tract; v, ventricle; s, somite. |

Knockdown of Asb2 attenuates normal cardiac development. The representative phenotype of zebrafish injected with MO targeting Asb2. (a) Scheme of the zebrafish experiment. Morpholino oligo designed for targeted gene knock down was injected to the eggs of zebrafish at 2–4 cell stage. At 72 hpf (hours post fertilization), phenotype was assessed. (b–d) MO targeting either the start codon (AAUG-MO) or the splice donor and acceptor site of exon 7 (ASP-MO) of Asb2 was injected into zebrafish embryos. At 72 hpf, both AAUG-MO and ASP-MO injection produced a phenotype of cardiac swelling (b). In histological analysis, thinner ventricle walls (c) and dilated ventricles (d) were observed in the AAUG- and ASP-MO injected groups compared to wild type siblings. In each group 5 to 7 animals were analysed. Note that no obvious change in phenotype was observed except in the heart. The data are shown as the mean ± SD. Statistical analysis was performed using one-way ANOVA with Tukey’s multiple comparison tests. *p < 0.05; ns, not significant; LPF, low power field; HPF, high power field; HE, Hematoxylin eosin; V, ventricle; A, atrium; P, pericardium. PHENOTYPE:
|
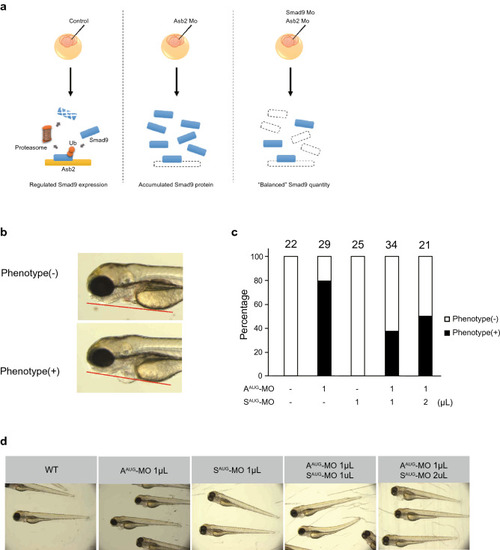
The phenotype of Asb2 knockdown is rescued by simultaneous knockdown of Smad9. (a) Scheme of the experimental hypothesis. The balanced amount of Smad9 protein is enabled by expression as well as degradation of Smad9. The injection of Asb2 Mo may result in loss of active degradation of Smad9 protein leading to the accumulation of Smad9. Simultaneous knockdown of Asb2 and Smad9 may attenuate the accumulation of Smad9 protein. Therefore, MO targeting the start codon of Asb2 (AAUG-MO) and/or Smad9 (SAUG-MO) was injected into zebrafish embryos at the 2–4 cell stage. At 72 hpf, the phenotype of the embryos was determined. (b) The cardiac phenotype was determined to be positive when the pericardium showed remarkable swelling over the tangent line of yolk and mandible. (c) The ratio of embryos with positive (black) and negative (white) phenotypes. The number of the animals is shown above each bar. (d) Representative animals of each group. No obvious phenotype was detected in any group. PHENOTYPE:
|
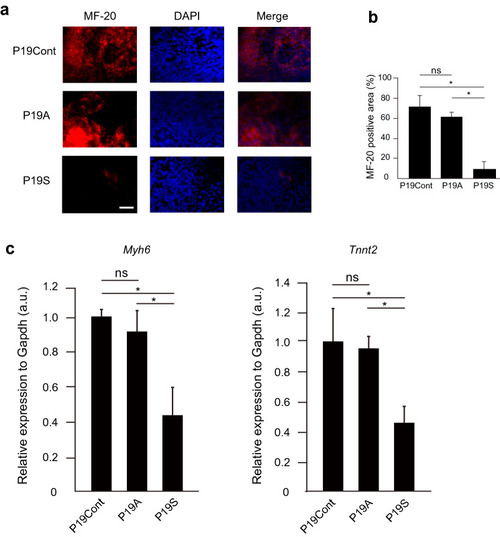
Accumulation, but not ablation of Smad9 attenuates cardiac differentiation. (a) Immunostaining of P19CL6 cells with anti MF-20 antibody after 12 days of induction of cardiac differentiation. The stable expression of Asb2 does not affect the cardiac induction while that of Smad9 suppress differentiation into cardiomyocytes. (b) MF-20 positive area. P19S shows siginificantly reduced MF-20 positive area. (c) The expression level of the common major cardiac marker Myh6 and TnnT2. P19S showed decreased expression of both markers. The data are shown as the mean ± s.d. Statistical analysis was performed using one-way ANOVA with Tukey’s multiple comparison tests. *p < 0.05; ns, not significant. |
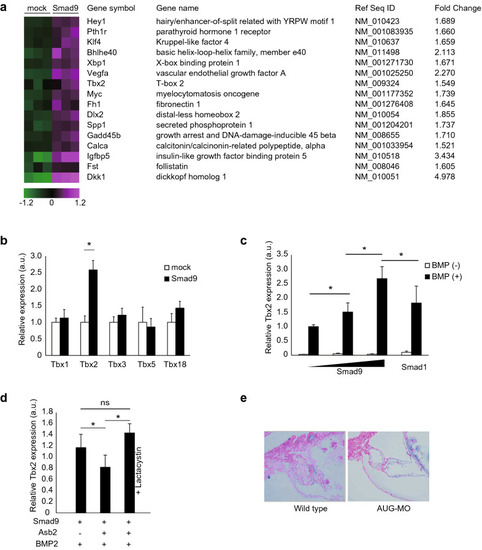
Tbx2 expression is regulated by SMAD9. (a) Search for SMAD9 target genes through comprehensive gene expression analysis. P19CL6 cells were transfected with either the mock vector or the vector coding Flag-SMAD9 and treated with 100 µM BMP2 for 24 h. RNA was collected and subjected to microarray analysis. Sixteen BMP-responsive genes were significantly upregulated by forced expression of SMAD9. (b) P19CL6 cells were transfected with either the mock vector or the vector encoding Flag-SMAD9 and treated with 100 µM BMP2 for 24 h. The expression levels of indicated genes were determined using quantitative real-time PCR. Among Tbx family, only Tbx2 was significantly induced by forced expression of SMAD9 under BMP2 stimulation. (c) From the left, 0, 0.1, and 1.0 µg of vector encoding Flag-SMAD9 and 1.0 µg of vector coding Flag-SMAD1 were transfected into P19CL6 cells. The expression level of Tbx2 was positively correlated with the amount of SMAD9. Greater induction of Tbx2 was observed upon transfection of SMAD9 compared to SMAD1. (d) Tbx2 expression was induced by treatment with BMP2. The expression level of Smad9 was blunted by co-expression of ASB2. The blunting effect of ASB2 was cancelled by treatment with 10 µM lactacystin for 16 h. (e) The histological section of zebrafish was subjected to alcian blue staining to visualize excess extracellular matrix induced by misexpression of Tbx2. The data are shown as the mean ± s.d. Statistical analysis was performed using one-way ANOVA with Tukey’s multiple comparison tests. *p < 0.05; ns, not significant; a.u., arbitrary unit. PHENOTYPE:
|