
- Title
-
Functional and ultrastructural analysis of reafferent mechanosensation in larval zebrafish
- Authors
- Odstrcil, I., Petkova, M.D., Haesemeyer, M., Boulanger-Weill, J., Nikitchenko, M., Gagnon, J.A., Oteiza, P., Schalek, R., Peleg, A., Portugues, R., Lichtman, J.W., Engert, F.
- Source
- Full text @ Curr. Biol.

Efference copy signals and lateral line circuitry.
(A) Schematic of a sensorimotor circuit comprising a sensory (blue) and motor pathway (yellow). Efference copy or corollary discharge signals (crimson) can arise from almost any level of the motor pathway and target any level in the sensory pathway. In the zebrafish, centrifugal fibers from the brain target the neuromasts directly. Adapted from Crapse and Sommer2. (B) Left: lateral view of a 7 dpf larva expressing GFP in lateral line sensory neurons (black). Anterior Lateral Line ganglion (ALLg) neurons innervate head neuromasts, and Posterior Lateral Line ganglion (PLLg) neurons innervate dorsal and tail neuromasts. Neuromasts with hair cells stained with DiASP (blue). Backfills of the posterior lateral line nerve (PLLn) via dye injections (magenta cross). Right: hair cells (HC) expressing GFP in a posterior neuromast of a 7 dpf larva. (C) Maximum intensity projection of the brain of a 6 dpf larva that received bilateral injections of fluorescent dextrans in the PLLn. Labeling reveals 3 cell clusters: the PLLg, the DELL, and the OEN with its caudal, rostral and supra-rostral subdivisions. In this fish only the caudal OEN was labeled. (D) Diagram showing the major components of the PLL circuit in the brain (light gray) and periphery. Neuromasts, sensory organs (gray), are activated by mechanosensory stimuli. Signals are transmitted to primary sensory/afferents neurons in the PLLg (light-blue). Descending inputs originate from the DELL (orange) and from the OEN (red). Afferent and efferent neurites join in the PLLn, and extend collateral branches to individual neuromasts. The circuit is midline (ml) symmetric but only one side is illustrated for clarity. See also Figure S1. |
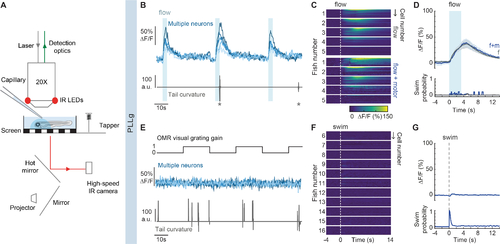
Functional imaging of primary sensory neurons in the PLLg during head-restrained swimming.
(A) Experimental setup. Calcium-dependent fluorescence signals are recorded using 2-photon microscopy and tail position is recorded simultaneously. Visual stimuli are projected under the animal, taps arise from a solenoid, and flow is delivered by pressure injection through a micropipette. (B) Example traces of top: fluorescence activity (ΔF/F) of flow-responsive neurons in the PLLg of a single GCaMP6s fish (light blue), and bottom: the animal’s concomitant cumulative tail curvature. Stars: swim bouts.(C) Average single-cell responses to 3.3 s of water flow delivery separated into instances that did and did not elicit motor responses. (Flow: n= 20, 26, 16, 24, 30 cells in 5 fish, Flow + motor: n= 18, 15, 16, 23, 15 cells of the same fish). Dotted line: flow onset. Since stimulus strength was calibrated to trigger behavior stochastically, some neurons were only imaged during flow delivery instances that did not elicit swimming, hence the discrepancy in cell number within individual fish across conditions. (D) Population average of stimulus-triggered neuronal activity in the PLLg (mean ΔF/F ± s.e.m.) in response to water flow that elicited (f+m, blue) and did not elicit (f, gray) motor responses (n= 5 fish). Averages arise from the single-cell measurements in Figure 2C. While the flow delivery period lasted 3.3 s, it is possible that a residual stimulus persisted after delivery was terminated. Bottom: swim probability during the same time period. (E) Example traces of top: fluorescence activity (ΔF/F) of 5 neurons in the PLLg of a single fish expressing GCaMP6s. A black and white grating was projected either statically or moving caudo-rostrally with respect to the fish at alternating 20 s intervals to promote swimming. Bottom: concomitant cumulative tail curvature. (F) Average single-cell responses (ΔF/F) during swim bouts in 11 fish (n= 22, 16, 19, 13, 17, 23, 27, 25, 22, 26, 23 cells). Dotted line: swim starts. (G) Population swim-triggered averages of neuronal activity in the PLLg (mean ΔF/F ± s.e.m.). Bottom: swim probability during the same period. Averages arise from the single-cell measurements in Figure 2F. See also Figure S2. |
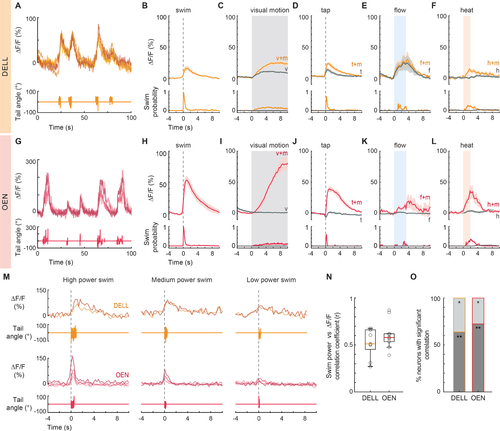
Activity of efferent nuclei during locomotion and in response to diverse sensory stimuli.
(A) Example traces of top: fluorescence activity (ΔF/F) of 4 DELL neurons in a single fish, and bottom: the animal’s cumulative tail curvature. (B-F) Top: Population activity (mean ΔF/F ± s.e.m.) of neurons in the DELL of GCaMP6s fish. Bottom: swim probability. (B) Average swim-triggered responses (n= 9 fish). (C) Average stimulus-triggered responses to moving visual gratings that elicited (v+m, orange) and failed to elicit (v, gray) swimming. (n= 11 fish). (D) Average stimulus-triggered responses to taps that elicited (t+m, orange) and did not elicit (t, gray) swimming (n= 7 fish). (E) Average stimulus-triggered responses to flow that elicited (f+m, orange) and did not elicit (f, gray) swimming (n= 3 fish). (F) Average stimulus-triggered responses during heat delivery events that elicited (h+m, orange) and did not elicit (h, gray) swimming (n=10 fish). (G) Example traces of top: fluorescence activity (ΔF/F) of 4 OEN neurons in a single fish, and bottom: the animal’s tail curvature. (H-L) Top: Population activity (mean ΔF/F ± s.e.m.) of neurons in the OEN of GCaMP6s fish. Bottom: swim probability. (H) Average swim-triggered responses (n= 8 fish). (I) Average stimulus-triggered responses to moving visual gratings that elicited (v+m, red) and failed to elicit (v, gray) swimming. (n= 7 fish). (J) Average stimulus-triggered responses to taps that elicited (t+m, red) and did not elicit (t, gray) swimming (n= 5 fish). (K) Average stimulus-triggered responses to flow that elicited (f+m, red) and did not elicit (f, gray) swimming (n= 5 fish). (L) Average stimulus-triggered responses during heat delivery events that elicited (h+m, red) and did not elicit (h, gray) swimming (n= 8 fish). (M) Fluorescence activity (ΔF/F) of single DELL (orange) and OEN (red) neurons during swims of high, medium, and low power. (n= 2 DELL and 4 OEN neurons. Nuclei imaged in different fish.) (N) Box plots showing the mean Pearson’s coefficients correlating the power of single swim bouts with the concurrent neuronal activity of efferent populations in individual GCaMP6f fish (circles, DELL: n= 9 fish, 2–3 neurons per animal; OEN: n= 10 fish, 2–9 neurons per animal). Medians shown in color. Plots derived from single-neuron analysis shown in Figures S3G and S3Q. (O) Percentage of cells per fish whose activity was significantly correlated with swim power. (DELL: n= 9, OEN: n= 10 fish; ** dark gray p < 0.001, * light gray p < 0.05). See also Figure S3. |

Volumetric reconstruction of a PLL neuromast in a 5 dpf fish from serial section electron microscopy data.
(A) Innervation of a PLL neuromast with 14 hair cells belonging to two equal populations of opposing polarities (rostro-caudal and caudo-rostral). Neuron identities were assigned by correlating anatomical ssEM data to fluorescent labeling of efferent types in the same neuromast. (Videos S1 and S2.) (B-E) Examples of specific connections. (Video S3.) (B) Hair cells (HC) and afferent neurons (AF) connect via ribbon synapses (right arrowhead). An efferent (EF) OEN terminal containing synaptic vesicles contacts the hair cell base containing postsynaptic membrane specializations (left arrowhead). (C) A vesicle-rich dopaminergic efferent terminal in the proximity of a hair cell. Note the distance between the efferent membrane and the hair cell, and the intercalated support cells (SC). (D) A vesicle-filled profile from a DELL efferent axon within the axon bundle, in close apposition to afferent neurites carrying information from both polarities. (E) An OEN efferent axon with vesicle release sites, in close apposition to an afferent neurite within the axon bundle that innervates the neuromast. (F) Histogram showing the distances between DELL (orange) or OEN (red) vesicle sites and the closest hair cell. (G) Connectivity matrix tallying all synaptic contacts observed in this neuromast. See also Figure S4. |

Swim-triggered activity of PLLg neurons after efferent nuclei ablation and in mutants lacking α9-nAChRs.
(A) Perturbation schematic. PLLg activity during swims before and after unilateral laser ablation of DELL neurons. Since DELL neurons do not cross the midline, contralateral PLL ganglia serve as controls. (B) Average swim-triggered responses (mean ΔF/F ± s.e.m.) before and after unilateral DELL ablations in neurons from PLL ganglia in the ipsilateral (left, blue lines) or contralateral (right, yellow lines) side to the ablation. Bottom panels: swim probability (n= 6 and 5 fish). (C) Boxplots of z-scored population ΔF/F per fish showing the difference in neuronal activity during swimming and quiescent periods of PLL ganglia located ipsilaterally (blue) or contralaterally (yellow) to the ablation site. Medians shown in color. Differences were computed for each fish before and after DELL ablations. Population values correspond to the median of all PLLg neurons for a given fish (individual cell values in Figure S5D). Paired 2-tailed Wilcoxon signed-rank test: pipsilateral = 0.2188, pcontralateral=1. (D) Circuit perturbation schematic. PLLg activity during swims before and after unilateral laser ablation of OEN neurons. OEN axons also do not cross the midline and therefore contralateral PLL ganglia serve as controls. (E) Average swim-triggered responses (mean ΔF/F ± s.e.m.) before and after unilateral OEN ablations in neurons from PLL ganglia in the ipsilateral (left, blue lines) or contralateral (right, yellow lines) side to the ablation. Bottom panels: swim probability (n= 6 and 5 fish). (F) Boxplots of z-scored population ΔF/F per fish showing the difference in neuronal activity during swimming and quiescent periods of PLL ganglia located ipsilaterally (blue) or contralaterally (yellow) to the ablation site. Medians shown in color. Differences were computed for each fish before and after OEN ablations. Population values correspond to the median of all PLLg neurons for a given fish (individual cell values in Figure S5E). Paired 2-tailed Wilcoxon signed-rank test: pipsilateral = 0.0313, pcontralateral= 0.8125. (G) Perturbation schematic. Hair cells receive cholinergic inputs from OEN efferent neurons (red). If hair cell inhibition is compromised in chrna9a mutants, this should be observed in the activity of PLLg neurons. (H) Average swim-triggered responses (mean ΔF/F ± s.e.m.) of PLLg neurons in chrna9aΔ1049 homozygous (blue) and heterozygous (cyan) siblings, and wild-type controls (wt, gray), (n= 8,14,12 fish). Wild-type fish correspond to one wt sibling and all animals from Figure 2F. Bottom: swim probability. (I) Boxplots of z-scored population ΔF/F per fish showing the difference in neuronal activity during swimming and quiescent periods in wildtype and mutant animals. Medians shown in color. (Kruskal-Wallis one-way analysis of variance, p= 0.0010. Unpaired 2-tailed Wilcoxon rank-sum test with post-hoc Bonferroni correction, pwt:+/− =0.0252, p+/−:−/− =0.0676, pwt:−/− = 3.9692×10⁻⁵). See also Figure S5. |